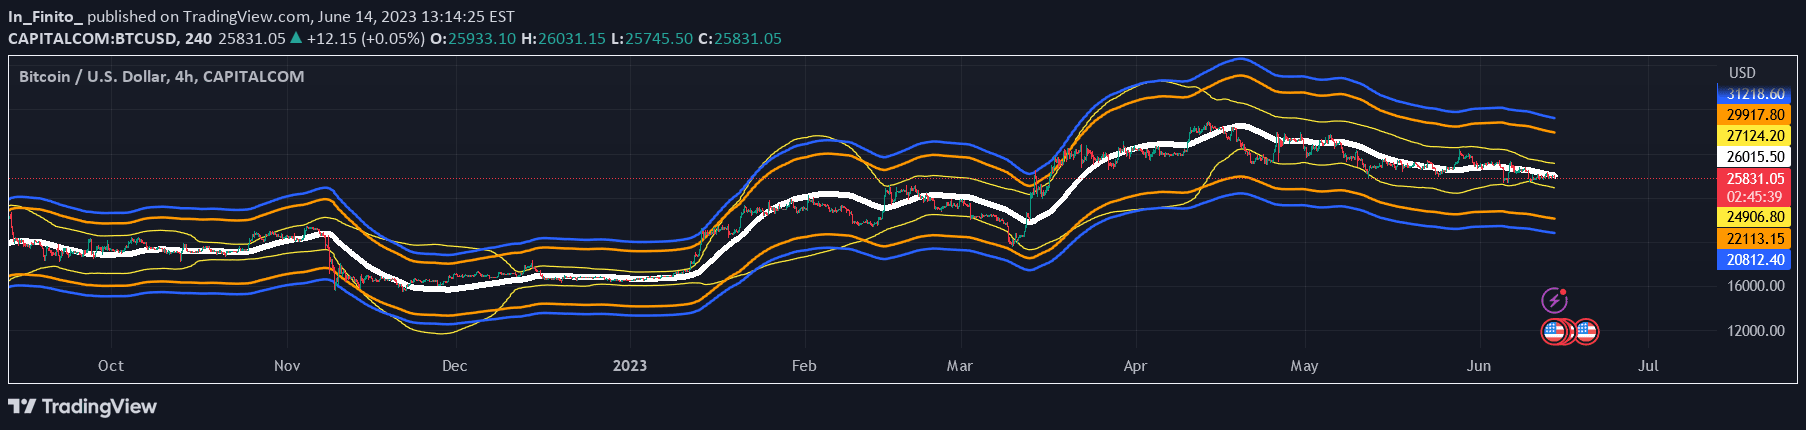
Advanced Bollinger Bands indicator tracking multiple symbols with real-time breakout alerts across up to 8 assets, using a 100-period moving average and configurable standard deviation.
Explore complementary indicator rolesHow it works
The script calculates Bollinger Bands using a 100-period simple moving average with a standard deviation multiplier, typically set at 3. It retrieves upper and lower band levels for selected symbols using request.security() function, which allows real-time monitoring across multiple assets simultaneously.
When the closing price of a monitored symbol breaks above the upper band, it triggers an 'Overbought' alert, and when it breaks below the lower band, it triggers an 'Oversold' alert. These alerts are generated at bar close, providing traders with immediate insights into potential market extremes across different trading instruments.
Why it may be useful
Bollinger Bands help traders identify potential market turning points by highlighting price extreme zones relative to a moving average. By monitoring multiple symbols simultaneously, traders can quickly assess market conditions across different assets without constantly watching multiple charts.
The indicator's unique design allows for passive multi-asset monitoring, enabling traders to receive instant alerts about potential overbought or oversold conditions. This approach saves time and provides a systematic method for tracking market volatility and potential trading opportunities across various financial instruments.
When to explore it
This Bollinger Bands indicator is most effective during trending and range-bound markets where price tends to respect upper and lower band boundaries. It works exceptionally well for traders seeking to identify potential reversal points or excessive price movements across multiple assets simultaneously.
Traders can utilize this tool in various market conditions, from highly volatile cryptocurrency markets to more stable stock indices. It is particularly useful for those who want a comprehensive overview of market conditions without manually monitoring each symbol, making it valuable for both active traders and those with a more hands-off approach.
Keep exploring
What we’ve verified
Access, alerts and repainting behaviour have not been independently verified for this indicator. Check the creator’s current publication and settings.
General descriptions and classifications are recovered research. Verified details above identify the specific checks we have completed. Check the creator’s current publication for later changes.