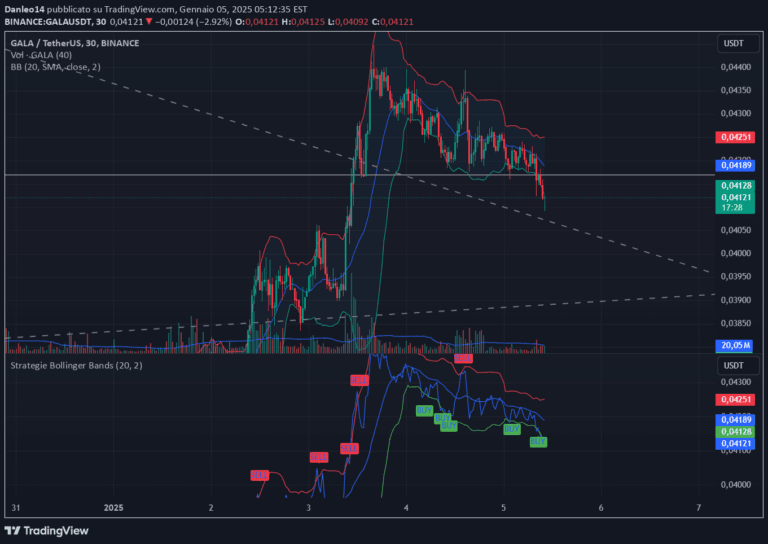
A custom Bollinger Bands indicator that identifies market reversals using adaptive bands, ATR-based stop-loss, and configurable take-profit levels for precise trade management.
Explore complementary indicator rolesHow it works
The Custom Bollinger Bands Indicator calculates dynamic price bands using a configurable Simple Moving Average (SMA) and standard deviation multiplier. It tracks price movements relative to these bands, highlighting candles that touch the upper or lower boundaries, which can indicate potential overbought or oversold conditions.
The indicator identifies reversal candles by specific criteria, including consecutive band touches and candle body size comparisons. It also incorporates an ATR-based stop-loss mechanism and plots two take-profit levels, allowing traders to dynamically manage risk and potential trade outcomes based on market volatility.
Why it may be useful
This indicator provides traders with a comprehensive tool for market analysis by combining multiple technical indicators into a single, user-friendly interface. It offers visual cues about potential market reversals, helping traders identify high-probability trading opportunities with greater precision and confidence.
By integrating risk management features like dynamic stop-loss calculations and configurable take-profit levels, the indicator empowers traders to make more informed decisions. The position sizing and leverage calculations further enhance trading strategy by providing clear, actionable information about potential trade risk and reward.
When to explore it
The Custom Bollinger Bands Indicator is most effective in markets with clear directional movements and identifiable trends. It works best in volatile market conditions where price fluctuations create opportunities for reversals and momentum shifts, such as during economic news releases or significant market events.
Traders should use this indicator in conjunction with other technical analysis tools to confirm signals and validate potential trade setups. It is particularly useful for short-term trading strategies like scalping and day trading, where quick identification of market reversals can lead to profitable opportunities.
Keep exploring
What we’ve verified
Access, alerts and repainting behaviour have not been independently verified for this indicator. Check the creator’s current publication and settings.
General descriptions and classifications are recovered research. Verified details above identify the specific checks we have completed. Check the creator’s current publication for later changes.