SMT Divergences [LuxAlgo]
An indicator that identifies divergences between swing points of a chart symbol and two external tickers, providing statistical insights into price behavior correlation.
Explore 11,183 indicators. Filter beyond the obvious.
Discover the tools that fit the way you trade.
11,183 tools to explore
An indicator that identifies divergences between swing points of a chart symbol and two external tickers, providing statistical insights into price behavior correlation.
A trading screener that identifies potential overbought or oversold market conditions across multiple symbols using a Mean Reversion Channel. Helps traders quickly scan assets for trading opportunities.
A dynamic trading panel displaying multiple technical indicators in a color-coded table format, allowing traders to quickly assess market conditions across multiple symbols simultaneously.
A trend-following indicator that dynamically detects market direction using SMA bands and provides automated visual cues for entries, stops, and targets directly on the chart.
A multi-symbol scanner that tracks price movements against previous day, week, and month highs and lows, providing visual and alert-based tracking of key market levels.
A trend strength indicator using Modified Hull Moving Average with a visual gauge that shows trend direction and intensity through color and transparency gradients.
A custom Tradingview indicator designed to display chart information cleanly while providing a personalized watermark for traders seeking discipline and self-mastery.
SMT Divergence identifies trend reversals by comparing price movements between two correlated financial assets, revealing potential market turning points through strategic divergence analysis.
A statistical tool analyzing price and volume variations across multiple symbols using Z-Score metrics to identify market trends, outliers, and potential trading opportunities.
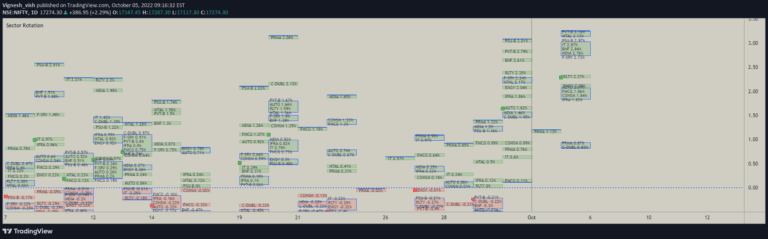
A comprehensive trading tool for visualizing and tracking performance across major Indian market sectors, allowing real-time and historical sector analysis with customizable visualization options.
A Pine Script tool for calculating Compound Annual Growth Rate (CAGR) by interactively selecting two time points on a chart, providing an annualized performance metric.
SMT Divergence identifies potential market reversals by comparing price behaviors between two correlated assets, revealing subtle signs of market manipulation and trend shifts.
Likes, views, and comments are historical TradingView snapshots. They describe attention, not trading performance.