
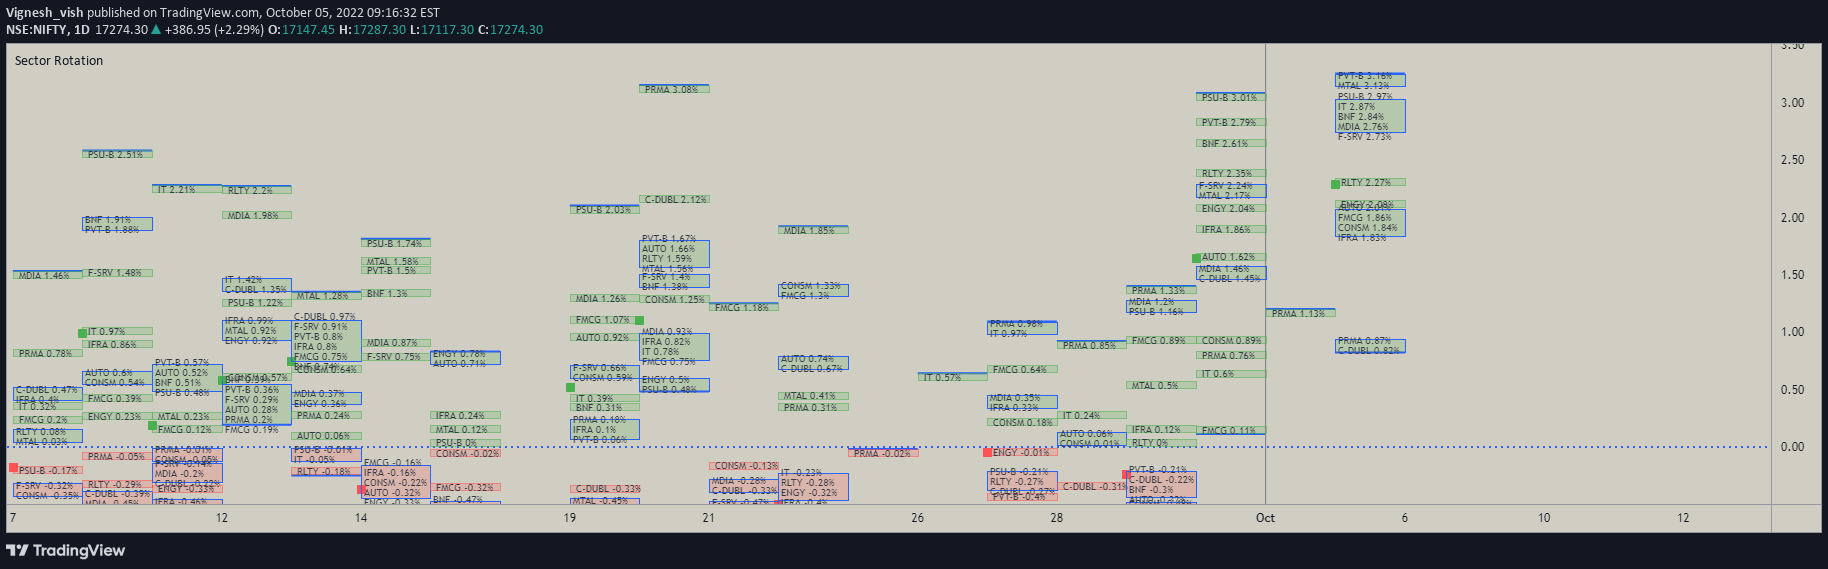
A comprehensive trading tool for visualizing and tracking performance across major Indian market sectors, allowing real-time and historical sector analysis with customizable visualization options.
Explore complementary indicator rolesHow it works
This trading script creates a comprehensive visual representation of Indian market sector performance across multiple timeframes. It uses short sector names to efficiently display data, enabling traders to quickly analyze sector movements.
Users can select specific sectors for plotting and highlight particular sectors with distinctive border colors. The script generates visual indicators like green squares to show current symbol performance and blue border boxes to indicate sector intersections
Why it may be useful
Sector analysis is crucial for understanding broader market dynamics and identifying potential investment opportunities. By providing a consolidated view of different market sectors, traders can quickly assess relative performance and market trends. The script's flexibility allows for customized sector tracking, making it easier to spot emerging patterns and compare sector performance across different timeframes
When to explore it
This tool is most effective when conducting market-wide analysis or searching for sector rotation opportunities. It works best for traders who want to understand inter-sector relationships and overall market sentiment.
Ideal for use during market hours when real-time sector performance is critical. Particularly useful for portfolio managers, institutional investors, and traders looking to make informed sector-based investment decisions
Keep exploring
What we’ve verified
Access, alerts and repainting behaviour have not been independently verified for this indicator. Check the creator’s current publication and settings.
General descriptions and classifications are recovered research. Verified details above identify the specific checks we have completed. Check the creator’s current publication for later changes.


