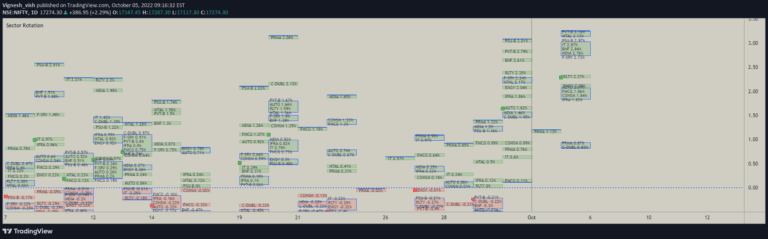
Multi-Asset Performance [Spaghetti] - By Leviathan
A multi-asset performance indicator that tracks percentage changes across 30 symbols, offering comprehensive insights into asset performance, correlation, and market dynamics.
Explore 11,183 indicators. Filter beyond the obvious.
Discover the tools that fit the way you trade.
11,183 tools to explore
A multi-asset performance indicator that tracks percentage changes across 30 symbols, offering comprehensive insights into asset performance, correlation, and market dynamics.
A trading tool that identifies top-performing stocks within specific industry groups by analyzing performance metrics like YTD return and relative strength.
A machine learning-enhanced momentum oscillator combining KNN algorithm and Tactical Sector Indicator to provide comprehensive insights into market trends and potential reversals.
A comprehensive RSI heatmap screener that provides multi-asset market sentiment analysis through color-coded RSI visualization and detailed trading insights.
The Double Ribbon indicator combines two Simple Moving Average ribbons to assess market trends and momentum, providing a visual and quantitative analysis of market direction and strength.
A dynamic market overview tool that tracks percentage changes across multiple indices or sectors, allowing traders to quickly assess performance and trends across different timeframes.
Chart pattern analysis focusing on flag and pennant formations that identify potential trend continuation after strong impulse waves, helping traders anticipate market momentum.
A comprehensive TradingView indicator for Bank Nifty index analysis using multiple technical indicators and advanced moving average techniques to generate trading signals.
A comprehensive market breadth indicator combining McClellan Summation Index with Heikin-Ashi visualization and MACD analysis to provide advanced trend and momentum insights.
A comprehensive trading tool for visualizing and tracking performance across major Indian market sectors, allowing real-time and historical sector analysis with customizable visualization options.
A Pine Script indicator that compares financial metrics across multiple companies in the same sector, providing comprehensive insights into stock performance using key financial ratios and moving averages.
A comprehensive trading tool that compares fundamental metrics across multiple assets using various charting methods, enabling detailed financial analysis and visualization.
Likes, views, and comments are historical TradingView snapshots. They describe attention, not trading performance.