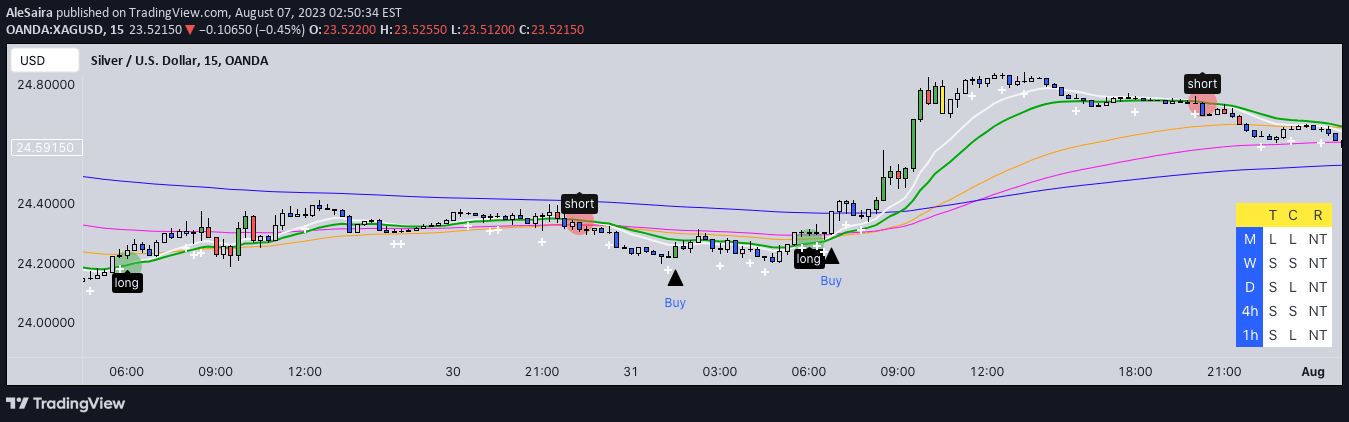
A trading indicator that highlights the first candle breaking a previous structural high or low within a defined look-back period, signaling potential trend reversals or continuations.
Explore complementary indicator rolesHow it works
The BoS Yellow Candle indicator scans price action within a user-defined look-back range, typically between 7 to 12 candles. It identifies structural breaks by comparing the current candle's high or low against previous price extremes. When the price breaks above the highest high or below the lowest low, the first candle signaling this break is marked with a distinctive yellow body.
This mechanism allows traders to quickly recognize potential trend change or continuation points. By dynamically tracking price structure, the indicator provides a visual representation of market momentum shifts, highlighting critical moments where price movement suggests a significant market sentiment transition.
Why it may be useful
The BoS Yellow Candle indicator offers traders a precise visual tool for identifying potential trend reversals and breakout opportunities. By clearly marking the first candle that breaks a significant price structure, it helps traders recognize critical market transition points with greater clarity and confidence.
This can be especially valuable in volatile or uncertain market conditions. Moreover, the indicator's adaptability across different timeframes makes it a versatile tool for various trading styles. Its simple yet powerful visual signal can help traders make more informed decisions about potential entry and exit points, reducing the complexity of trend analysis.
When to explore it
The BoS Yellow Candle indicator is most effective in markets with clear trending characteristics, such as forex, stocks, and cryptocurrencies. It works best in timeframes that provide enough price history to establish meaningful structural levels, typically ranging from 15-minute to daily charts. Traders should use this indicator in conjunction with other technical analysis tools to confirm signals and validate potential trade setups.
The indicator is particularly useful during periods of market volatility or when price is testing significant support and resistance levels. Traders should pay special attention to the context of the yellow candle, considering overall market trend, volume, and additional technical indicators to enhance the reliability of the signal.
Keep exploring
What we’ve verified
Access, alerts and repainting behaviour have not been independently verified for this indicator. Check the creator’s current publication and settings.
General descriptions and classifications are recovered research. Verified details above identify the specific checks we have completed. Check the creator’s current publication for later changes.