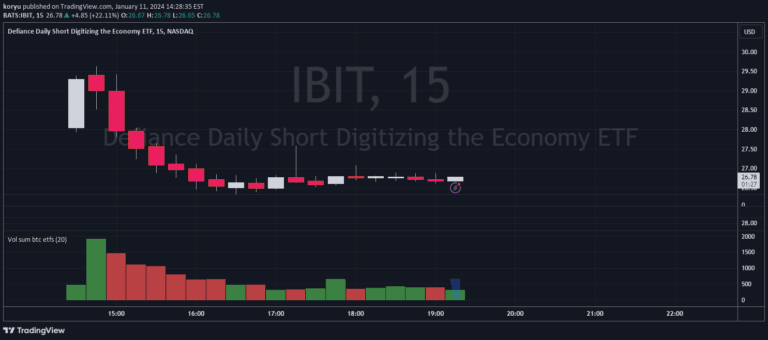
A comprehensive volume tracking script for Bitcoin spot ETFs that visualizes individual and aggregate trading volumes across different ETF instruments.
Explore complementary indicator rolesHow it works
The script aggregates and displays volume data for multiple Bitcoin spot ETFs on a single chart, using distinct colors for each ETF's trading volume. It calculates and plots the total volume column, representing the cumulative trading activity across all tracked ETF instruments.
By providing a color-coded breakdown, traders can easily visualize the individual contribution of each ETF to the overall trading volume. The script automatically updates to include new Bitcoin ETFs as they are launched, ensuring comprehensive volume tracking.
Why it may be useful
Volume analysis is crucial for understanding market sentiment and potential price movements in cryptocurrency trading. This script offers traders a comprehensive view of Bitcoin ETF trading activity, allowing them to assess market participation and liquidity across different investment vehicles.
By presenting both individual and aggregate volume data, traders can identify which ETFs are driving market activity and make more informed trading decisions. The visual representation helps quickly interpret market dynamics and potential trend strength.
When to explore it
This volume tracking script is most effective during periods of significant market activity or when comparing trading volumes across different Bitcoin ETF instruments. Traders can use it to identify which ETFs are experiencing the most trading interest and potentially leading market movements.
It is particularly useful during key market events, earnings reports, or when analyzing broader market trends in cryptocurrency investment. The script provides valuable insights for traders looking to understand the distribution of trading volume among different Bitcoin ETF products.
Keep exploring
What we’ve verified
Access, alerts and repainting behaviour have not been independently verified for this indicator. Check the creator’s current publication and settings.
General descriptions and classifications are recovered research. Verified details above identify the specific checks we have completed. Check the creator’s current publication for later changes.