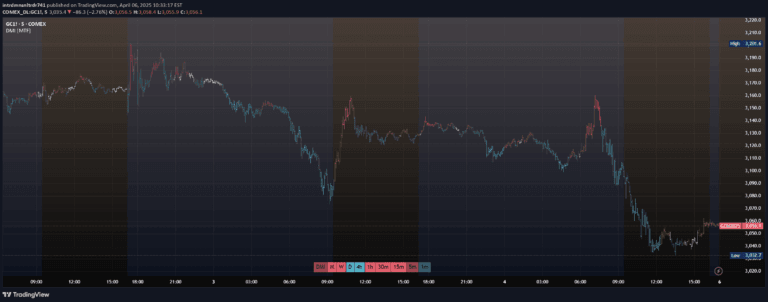
A risk-adjusted performance indicator that compares assets' returns against a benchmark using the Ulcer Performance Index, revealing relative performance through green and red zone visualizations.
Explore complementary indicator rolesHow it works
The BTC Slayer 9000 calculates the Ulcer Performance Index (UPI) by measuring an asset's returns against its downside risk using the Ulcer Index. It compares this UPI to a chosen benchmark, generating a Relative UPI (RUPI) that shows performance relative to the benchmark.
By plotting the RUPI on a chart, traders can see when an asset outperforms (green area) or underperforms (red area) the benchmark. The indicator allows customization of the lookback period and comparison chart, providing flexible and dynamic risk-adjusted performance analysis.
Why it may be useful
This indicator provides traders with a sophisticated method to evaluate risk versus reward across different assets and markets. It transforms complex risk metrics into an easily interpretable visual format, allowing traders to quickly assess whether an asset's potential returns justify its associated risks.
By offering a systematic approach to comparing performance, the BTC Slayer 9000 helps traders make more informed investment decisions. It bridges the gap between raw performance data and meaningful risk assessment, enabling more strategic asset selection and portfolio management.
When to explore it
The BTC Slayer 9000 is most effective when comparing assets within the same market category, such as cryptocurrencies or stocks. It works best with assets that have sufficient historical price data to generate meaningful risk calculations. Traders can use it to identify potentially undervalued assets or to compare different investment opportunities.
Ideal usage includes evaluating alternative investments, assessing portfolio diversification strategies, and making data-driven decisions about asset allocation. The indicator is particularly useful for traders who prioritize risk-adjusted returns over simple price movement.
Keep exploring
What we’ve verified
Access, alerts and repainting behaviour have not been independently verified for this indicator. Check the creator’s current publication and settings.
General descriptions and classifications are recovered research. Verified details above identify the specific checks we have completed. Check the creator’s current publication for later changes.