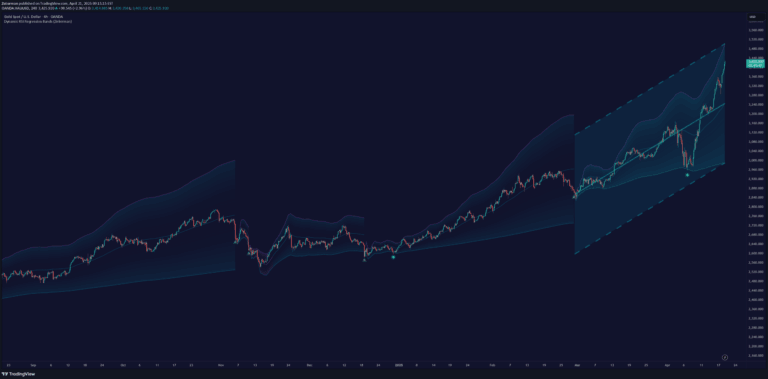
Advanced Sharpe Ratio indicator with dynamic upper and lower bands that measure risk-adjusted returns and help traders identify extreme performance levels.
Explore complementary indicator rolesHow it works
The Sharpe Ratio with Upper/Lower Bands calculates performance by comparing an asset's returns against its risk, typically measured by standard deviation. It generates a numerical score that represents risk-adjusted performance, with higher values indicating more efficient returns relative to volatility.
The indicator then develops dynamic upper and lower bands by analyzing the historical mean and standard deviation of the Sharpe Ratio. These bands create visual thresholds that help traders quickly identify when the current risk-adjusted performance deviates significantly from its typical range, offering insights into potential market inefficiencies.
Why it may be useful
The Sharpe Ratio provides traders with a sophisticated method of evaluating investment performance that goes beyond simple return calculations by incorporating risk into the analysis. By understanding how much return is generated per unit of risk, investors can make more informed decisions about portfolio allocation and strategy.
The added upper and lower bands enhance traditional Sharpe Ratio analysis by providing immediate visual context, allowing traders to rapidly assess whether current performance is exceptional, typical, or underperforming compared to historical patterns.
When to explore it
This indicator is most effective in markets with moderate to high volatility where risk-adjusted performance becomes crucial for decision-making. It works particularly well when analyzing longer-term investment strategies or comparing different assets' efficiency across various market conditions.
Traders should leverage this indicator when evaluating portfolio performance, selecting investment opportunities, or assessing the consistency of trading strategies. It is especially valuable during periods of market uncertainty or when comparing multiple potential investments with different risk profiles.
Keep exploring
What we’ve verified
Access, alerts and repainting behaviour have not been independently verified for this indicator. Check the creator’s current publication and settings.
General descriptions and classifications are recovered research. Verified details above identify the specific checks we have completed. Check the creator’s current publication for later changes.