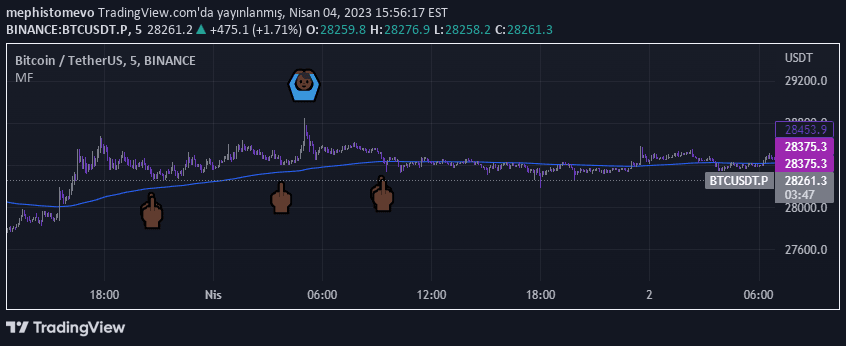
Bull & Bear Power indicator measures buying and selling pressure by comparing high and low prices to a 13-period EMA, revealing market momentum and potential trend reversals.
Explore complementary indicator rolesHow it works
The Bull & Bear Power indicator calculates market momentum using a 13-period Exponential Moving Average (EMA) as a baseline. It computes Bull Power by subtracting the EMA from the high price, which represents buying pressure.
Simultaneously, Bear Power is calculated by subtracting the EMA from the low price, representing selling pressure. The resulting values are plotted as separate lines, with green indicating bull power and red showing bear power, allowing traders to visually assess market dynamics.
Why it may be useful
This indicator provides traders with a clear visual representation of market momentum and underlying buying or selling pressure. By quantifying the strength of bulls and bears relative to a moving average, it helps traders understand the current market sentiment and potential trend shifts.
The Bull & Bear Power indicator offers insights into market psychology, revealing whether buyers or sellers are currently in control. This information can be crucial for making informed trading decisions, especially when used in conjunction with other technical analysis tools.
When to explore it
The Bull & Bear Power indicator works best during trending markets, where clear momentum can be identified and measured. It is particularly effective when combined with other technical indicators like moving averages or price action signals to confirm potential entry and exit points.
Traders can use this tool across various timeframes, from short-term scalping to longer-term swing trading. It is especially useful on liquid markets like forex and commodities, where momentum and trend strength play a significant role in price movements.
Keep exploring
What we’ve verified
Access, alerts and repainting behaviour have not been independently verified for this indicator. Check the creator’s current publication and settings.
General descriptions and classifications are recovered research. Verified details above identify the specific checks we have completed. Check the creator’s current publication for later changes.