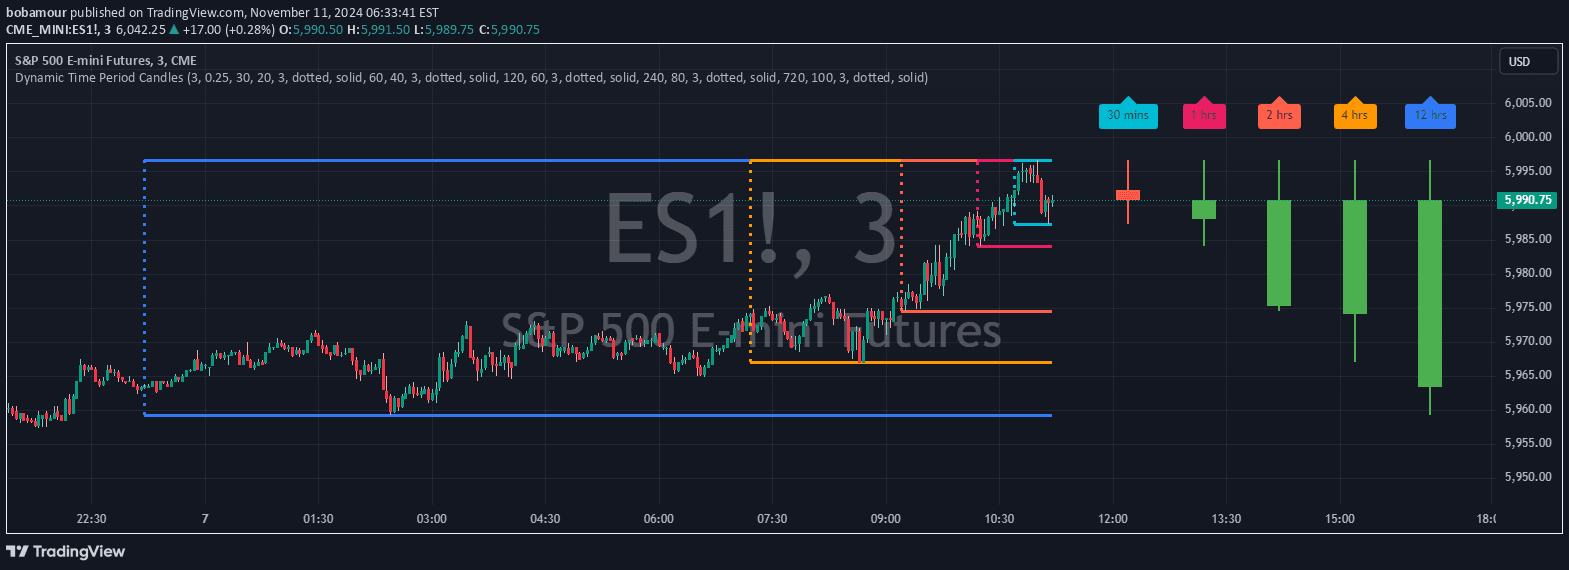
A market sentiment indicator that tracks bullish and bearish candles, calculating their percentages to help traders understand current price action and market dynamics.
Explore complementary indicator rolesHow it works
The Bull vs Bear Candles indicator systematically counts and analyzes the number of bullish and bearish candles within a selected time range. It begins by identifying each candle's directional movement, categorizing them as either bullish (green/positive) or bearish (red/negative) based on their opening and closing prices.
Once categorized, the indicator calculates the percentage of bullish and bearish candles, providing a clear visual representation of market sentiment. By comparing these percentages, traders can quickly determine whether bulls or bears are currently controlling the market, offering insights into potential trend strength and direction.
Why it may be useful
Understanding market sentiment is crucial for making informed trading decisions, and the Bull vs Bear Candles indicator provides a straightforward method to gauge market momentum. By quantifying the proportion of bullish and bearish candles, traders can gain immediate insights into the underlying market psychology and potential trend reversals.
This indicator helps traders cut through market noise and focus on the most relevant price action information. It transforms complex market dynamics into an easily digestible format, allowing traders to make more confident and data-driven decisions about potential entry and exit points.
When to explore it
The Bull vs Bear Candles indicator is most effective during periods of clear market movement and when traders want a quick snapshot of current market sentiment. It works exceptionally well in volatile markets where price action is more pronounced and directional movements are more evident.
Traders should use this indicator in conjunction with other technical analysis tools to confirm signals and validate market trends. It is particularly useful for short-term trading strategies like scalping and day trading, where quick assessment of market direction can lead to more precise trading decisions.
Keep exploring
What we’ve verified
Access, alerts and repainting behaviour have not been independently verified for this indicator. Check the creator’s current publication and settings.
General descriptions and classifications are recovered research. Verified details above identify the specific checks we have completed. Check the creator’s current publication for later changes.