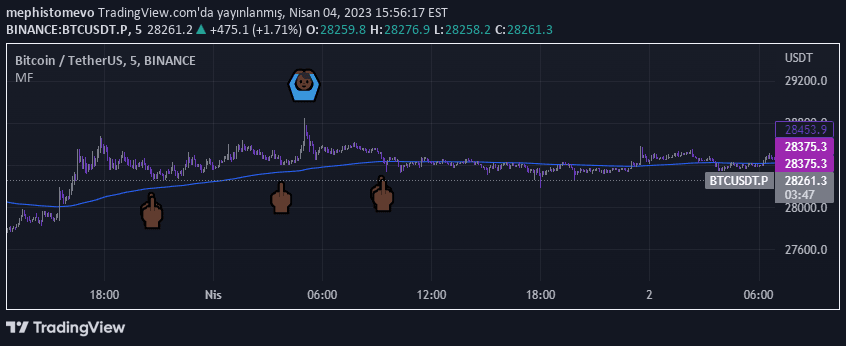
A volatility-based indicator using Williams VIX Fix that generates buy and sell signals by analyzing price fluctuations through Bollinger Bands and percentile ranges.
Explore complementary indicator rolesHow it works
The Williams VIX Fix (WVF) indicator calculates volatility by comparing the highest closing price to the lowest price over a specific period. It generates a percentage value that represents market price fluctuations, helping traders identify potential market conditions.
The indicator uses Bollinger Bands constructed around the WVF's moving average, with standard deviation determining upper and lower boundaries. By analyzing these bands and percentile-based ranges, the script generates precise buy and sell signals when the WVF crosses specific thresholds or reaches extreme volatility levels.
Why it may be useful
The Williams VIX Fix provides traders with a nuanced understanding of market volatility, allowing them to make more informed trading decisions. By quantifying price fluctuations, it helps identify potential trend reversals and market sentiment shifts that might not be apparent through traditional price analysis.
This indicator is particularly valuable because it combines multiple analytical techniques, including percentile ranges and Bollinger Bands, to create a comprehensive volatility assessment. Traders can use these insights to anticipate potential market movements and adjust their strategies accordingly.
When to explore it
The Williams VIX Fix is most effective in markets experiencing significant price fluctuations and potential trend reversals. It works best in volatile markets where traditional trend-following strategies might fail, providing traders with early warning signals of potential market shifts.
Traders should consider using this indicator during periods of economic uncertainty, earnings announcements, or major market events when price volatility is likely to increase. It is particularly useful for short-term trading strategies that capitalize on rapid market movements and require quick decision-making.
Keep exploring
What we’ve verified
Access, alerts and repainting behaviour have not been independently verified for this indicator. Check the creator’s current publication and settings.
General descriptions and classifications are recovered research. Verified details above identify the specific checks we have completed. Check the creator’s current publication for later changes.