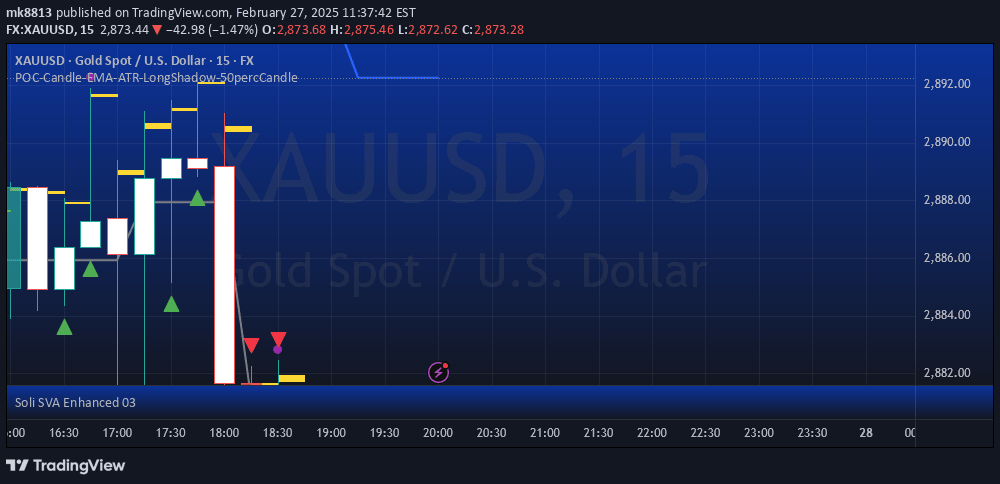
A custom candlestick visualization tool that highlights candle close positions and displays volume with moving averages, helping traders understand market momentum and sentiment.
Explore complementary indicator rolesHow it works
The script transforms traditional candlestick charts by adding an innovative visual element: a small orange marker indicating the precise location of the candle's close within its price range. This marker helps traders quickly identify whether the close occurred in the upper, middle, or lower part of the candle's body, providing immediate insight into market sentiment.
Complementing the candle visualization, the script integrates a volume histogram with two distinct moving averages (SMA 20 and SMA 50). These moving averages track volume trends, helping traders understand the underlying strength and potential momentum shifts in the market.
Why it may be useful
Traditional candlestick charts can be challenging to interpret quickly, especially for traders who need to make rapid decisions. By color-coding candles and adding a precise close-position marker, this script allows traders to instantly gauge market sentiment and potential directional shifts without extensive manual analysis.
The volume moving averages provide an additional layer of analytical depth, enabling traders to confirm price movements with corresponding volume trends. This integrated approach helps traders validate potential trade setups, reducing the risk of false signals and improving overall trading decision-making.
When to explore it
This visualization tool is most effective in volatile markets with significant price movements, where understanding precise candle dynamics can provide a competitive edge. It works particularly well in liquid markets like forex, stocks, and cryptocurrency, where rapid price changes and volume fluctuations are common.
Traders should utilize this script during key market sessions, such as overlap periods between major exchanges or during economic news releases. It is especially useful for momentum traders who rely on quick visual cues to make trading decisions across various timeframes.
Keep exploring
What we’ve verified
Access, alerts and repainting behaviour have not been independently verified for this indicator. Check the creator’s current publication and settings.
General descriptions and classifications are recovered research. Verified details above identify the specific checks we have completed. Check the creator’s current publication for later changes.