
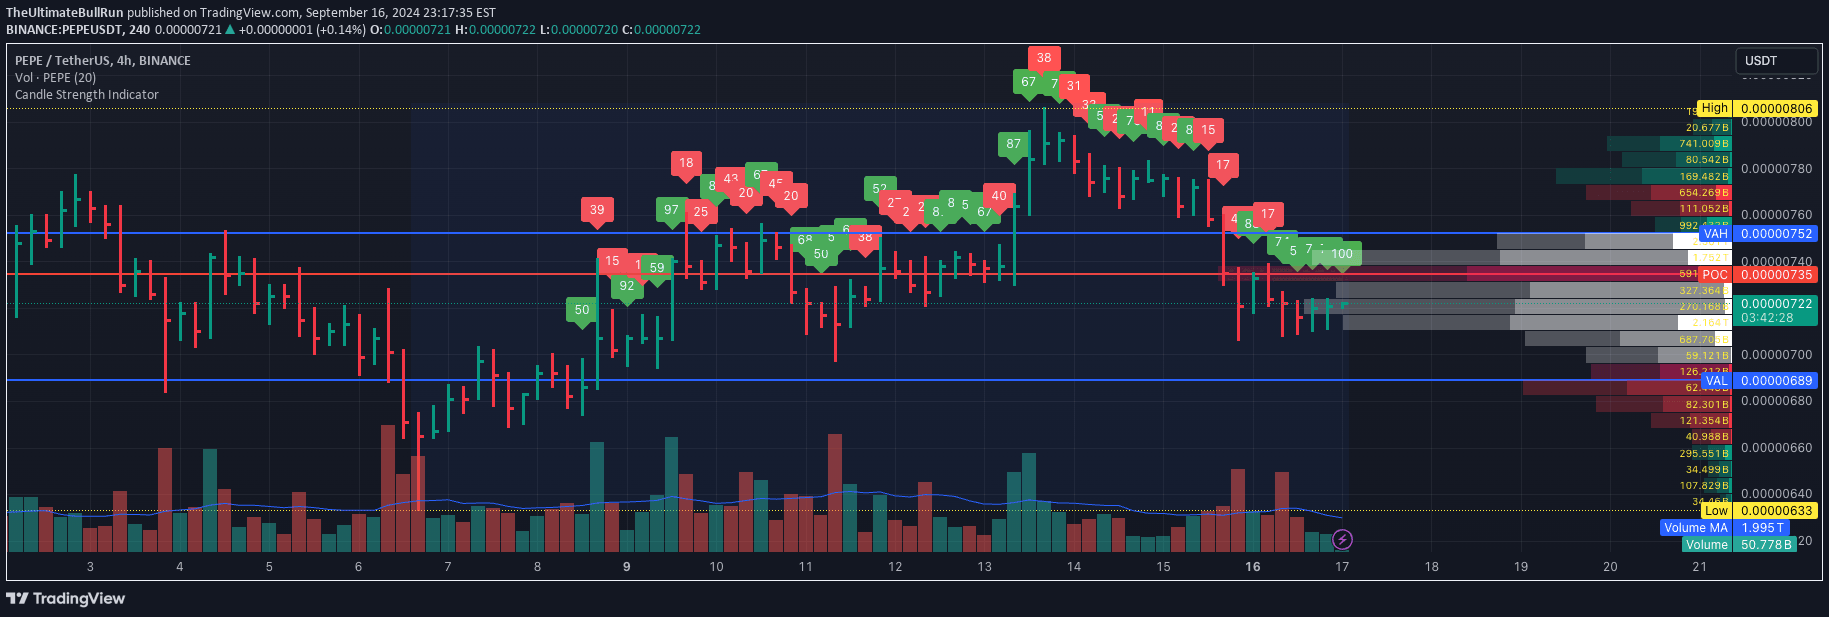
A price action strength indicator that measures candle closing positions on a 0-100 scale, revealing bullish or bearish momentum through color-coded visual representation.
Explore complementary indicator rolesHow it works
The indicator calculates the closing strength of each candle by determining its position within the total price range. It assigns a numerical value from 0 to 100, with 0 representing a close at the candle's lowest point and 100 indicating a close at the highest point. The midpoint of 50 represents a neutral closing position, providing traders with a quick visual assessment of price momentum.
By mapping the closing price relative to the entire candle range, the indicator offers an intuitive representation of price action strength. Traders can quickly interpret the signal through color-coding, with green indicating bullish momentum (values 50 and above) and red signaling bearish momentum (values below 50).
Why it may be useful
This price action strength indicator provides traders with an immediate, visual understanding of market sentiment and potential price movement direction. By converting complex price data into a simple 0-100 scale, it allows traders to quickly assess the underlying strength of each candle without requiring complex calculations or extensive technical analysis experience.
The color-coded visualization enables rapid decision-making, helping traders identify potential trend shifts and momentum changes across different timeframes. By offering a standardized method of evaluating price action, the indicator can serve as a complementary tool to other technical analysis methods, enhancing overall trading strategy and market interpretation.
When to explore it
The price action strength indicator is most effective in markets with clear trending characteristics, such as forex, stocks, and cryptocurrency markets. It works exceptionally well during periods of consistent price movement, helping traders identify potential continuation or reversal points by analyzing the closing strength of consecutive candles.
Traders should use this indicator in conjunction with volume analysis and other technical indicators to confirm signals and reduce false interpretations. It is particularly useful during high-volatility periods, where rapid price changes can provide multiple opportunities for entry and exit points across different trading timeframes.
Keep exploring
What we’ve verified
Access, alerts and repainting behaviour have not been independently verified for this indicator. Check the creator’s current publication and settings.
General descriptions and classifications are recovered research. Verified details above identify the specific checks we have completed. Check the creator’s current publication for later changes.


