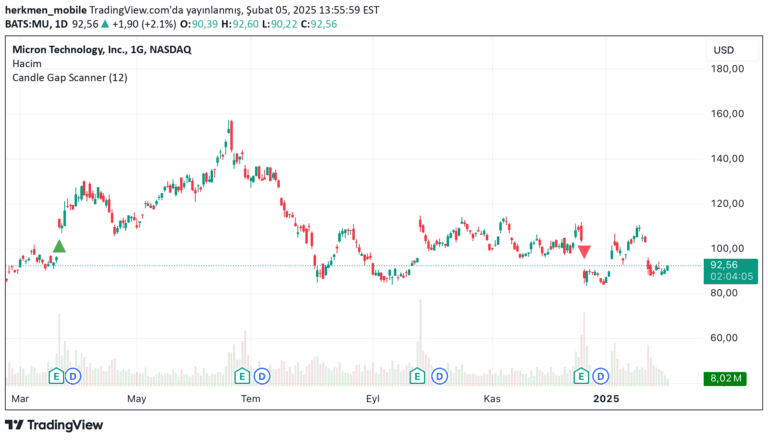
A TradingView indicator that dynamically identifies statistically significant candles by analyzing their size relative to recent historical price action, highlighting strong or weak market conditions.
Explore complementary indicator rolesHow it works
The Strong/Weak Candle Finder calculates candle sizes using four potential methods: high-low range, high-close distance, open-close body, or low-open distance. It analyzes a specified historical lookback period to establish a statistical distribution of candle sizes.
The indicator then groups these sizes into precision bins and determines a dynamic threshold based on a user-selected percentile. When a current candle exceeds or falls below this threshold, it is classified as either strong or weak, depending on the selected display mode.
Why it may be useful
This indicator provides traders with a data-driven approach to understanding market dynamics by objectively measuring candle size variations. By dynamically adapting to market conditions, it offers insights into potential momentum shifts, volatility changes, and market sentiment without relying on fixed, arbitrary measurements.
The tool's flexibility allows traders to customize their analysis, making it valuable for identifying potential breakouts, consolidation periods, and significant price movements across different market conditions and trading instruments.
When to explore it
The Strong/Weak Candle Finder is most effective in markets with clear trend characteristics or those experiencing significant volatility shifts. It works particularly well when traders want to identify potential momentum changes or assess market indecision during consolidation phases.
Traders should use this indicator in conjunction with other technical analysis tools to confirm signals and validate potential trade setups. It is especially useful for filtering entry points, understanding market rhythm, and gaining a statistical perspective on price action dynamics.
Keep exploring
What we’ve verified
Access, alerts and repainting behaviour have not been independently verified for this indicator. Check the creator’s current publication and settings.
General descriptions and classifications are recovered research. Verified details above identify the specific checks we have completed. Check the creator’s current publication for later changes.