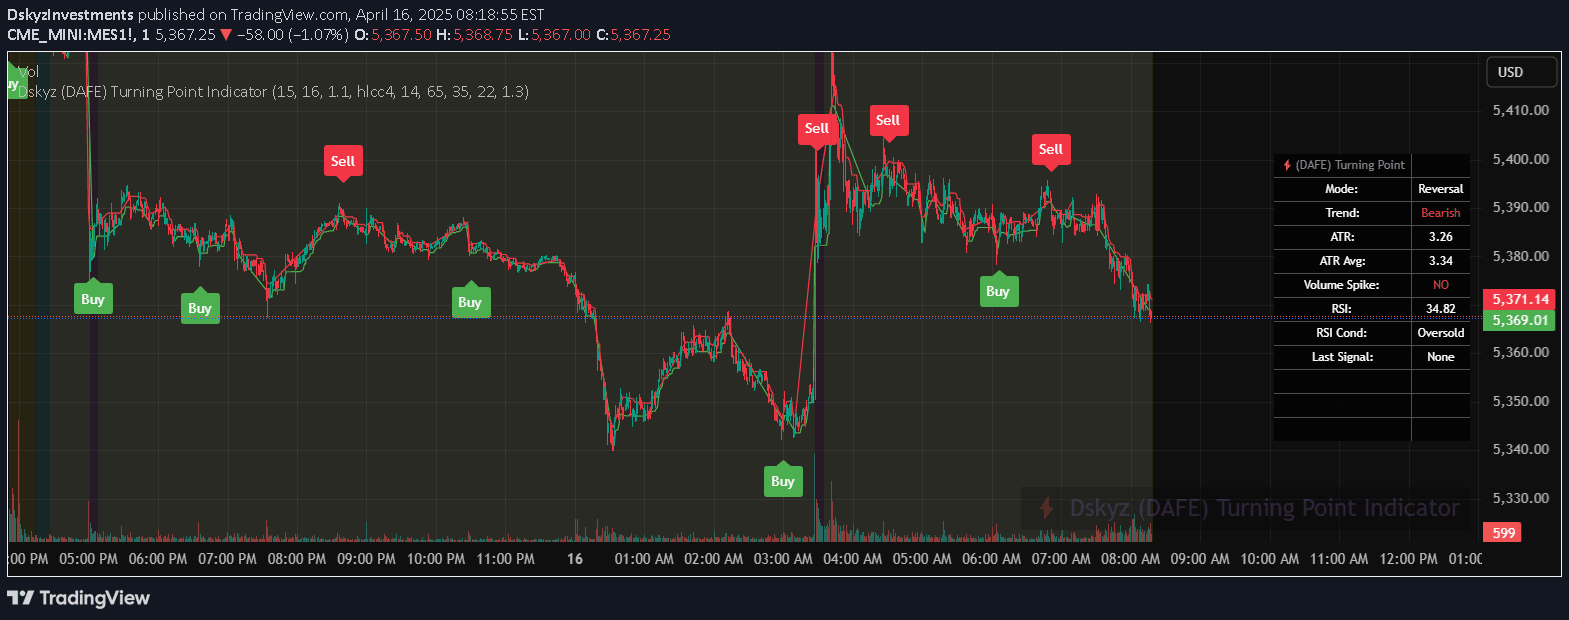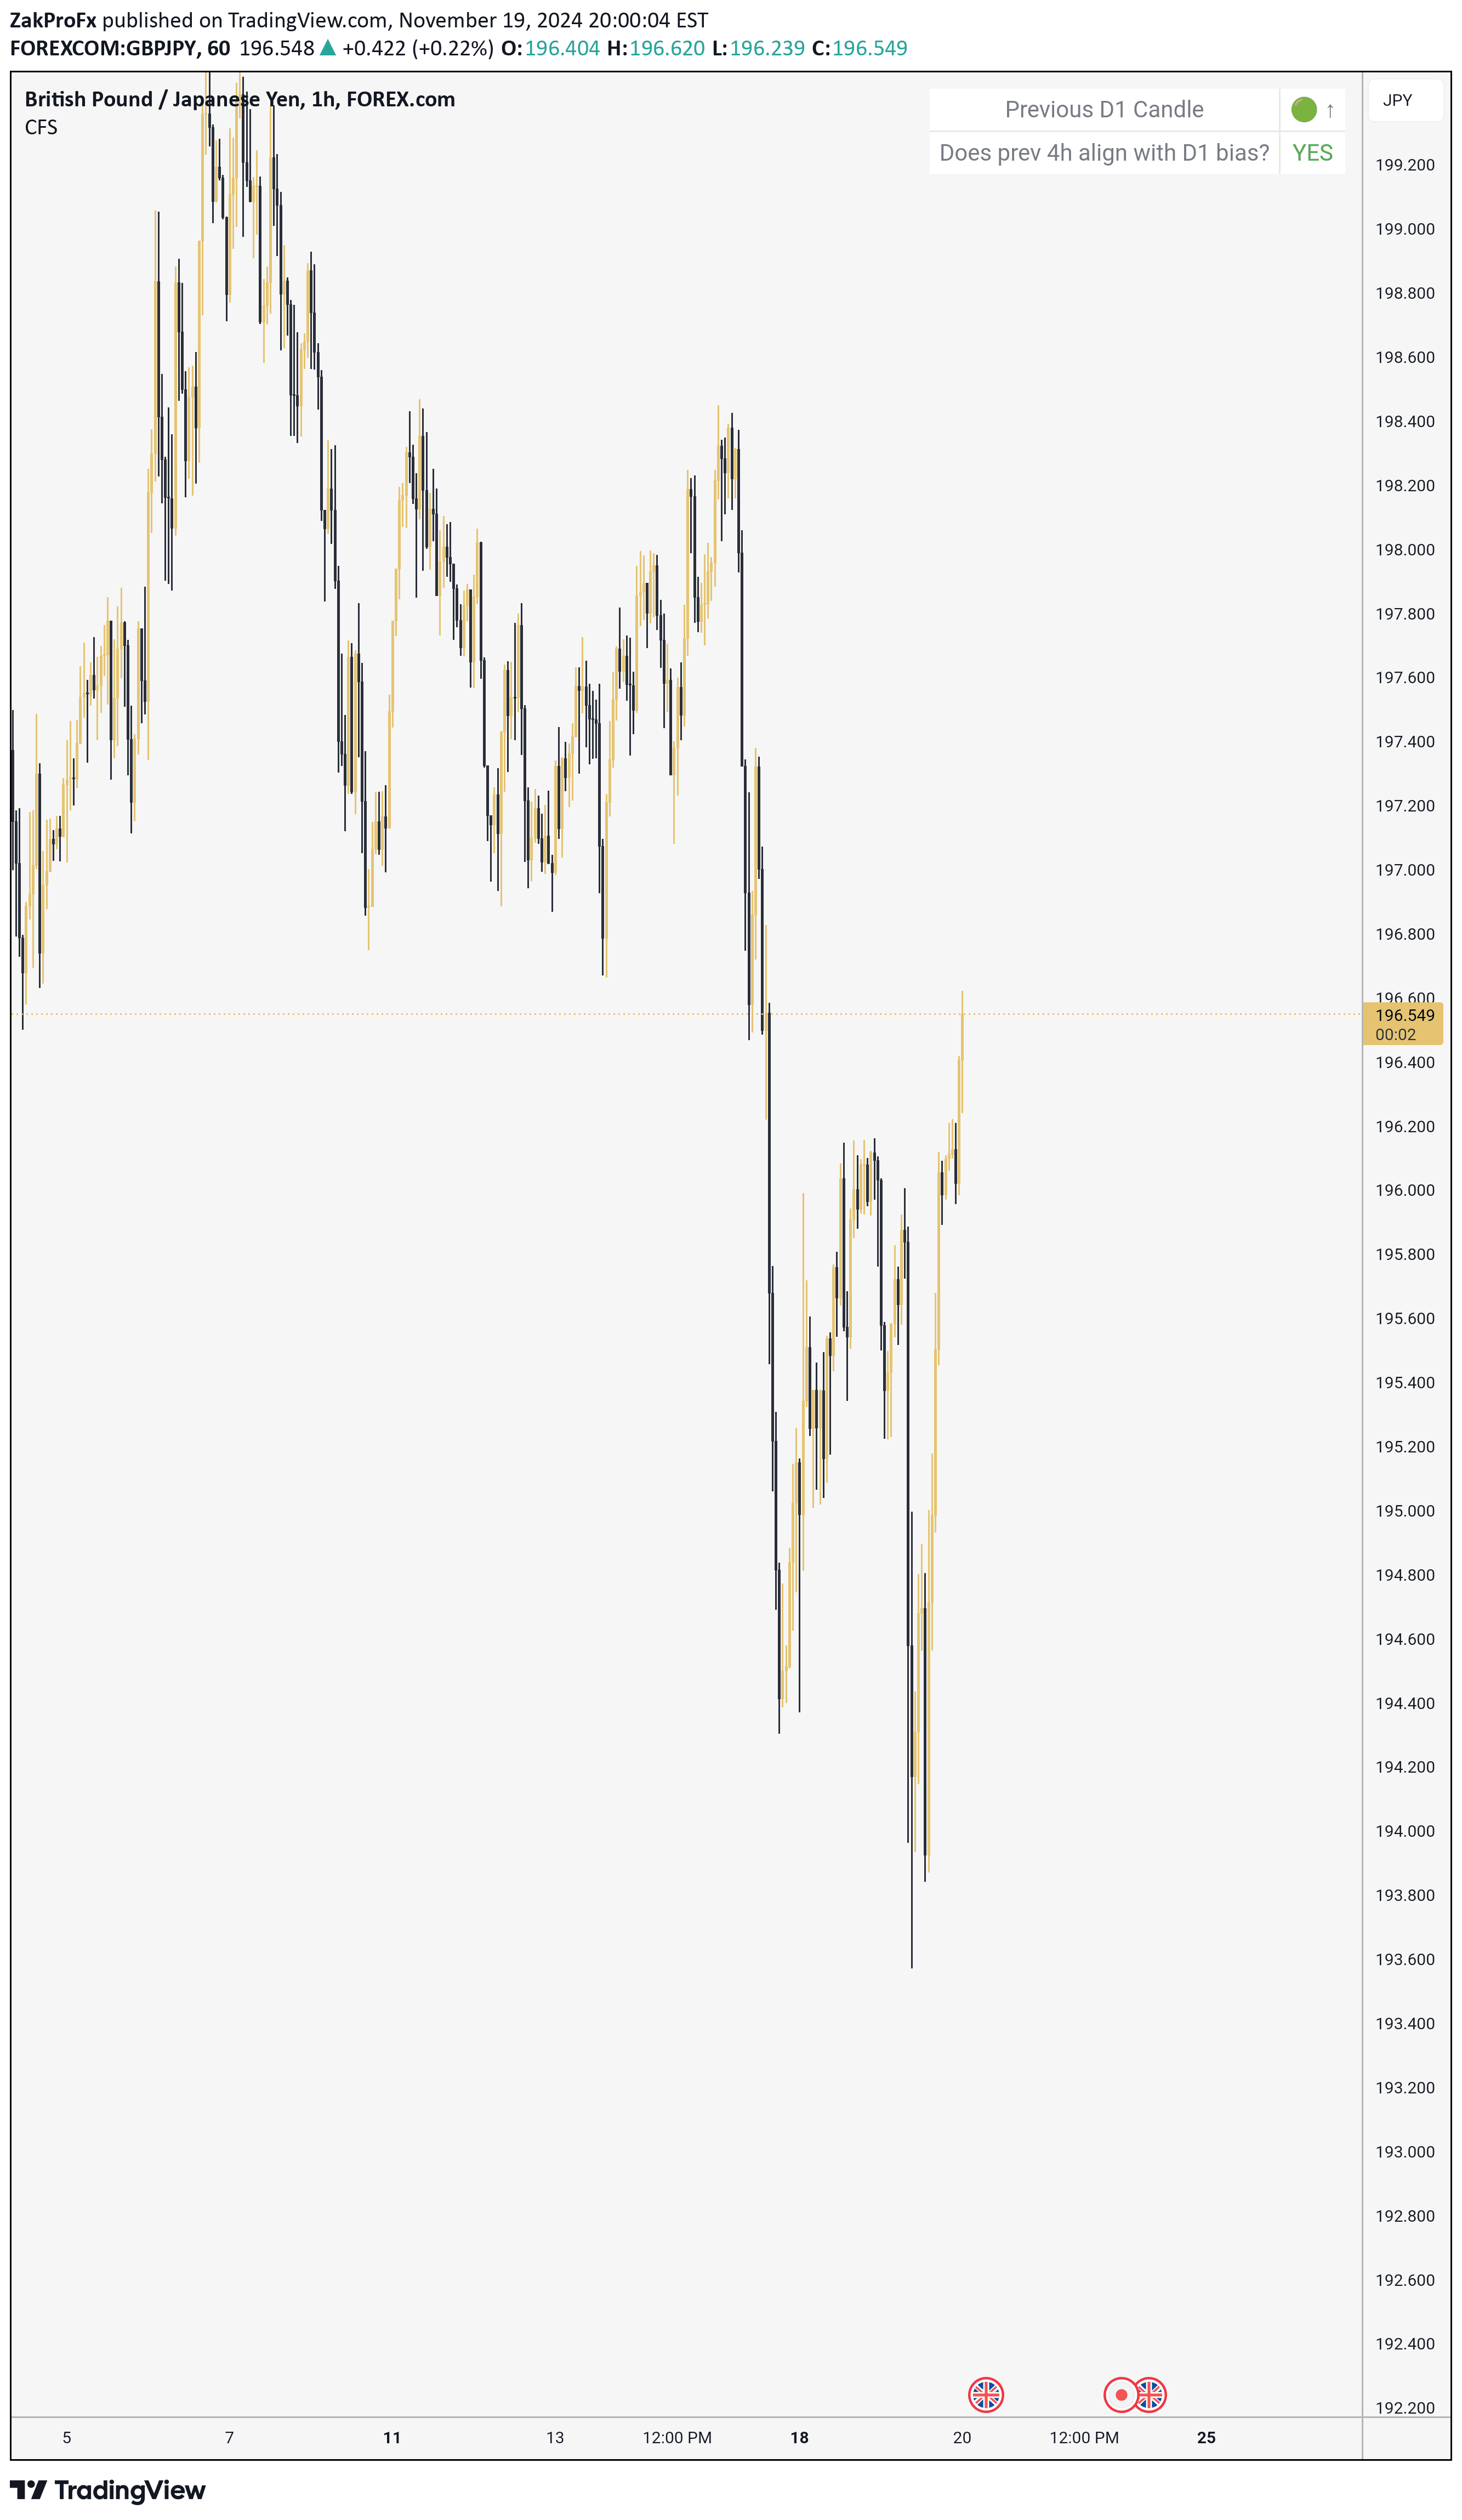
A systematic trading decision support tool that analyzes multiple timeframes to validate trade conditions by checking previous daily and 4-hour candle alignments.
Explore complementary indicator rolesHow it works
The Candle Flip System operates by first analyzing the previous daily candle's closing direction, identifying whether it closed bullishly or bearishly. It then cross-references this information with the previous 4-hour candle's bias to determine alignment.
The system creates a visual checklist that displays markers and color-coded indicators to help traders quickly assess market conditions. Green indicators signify alignment between timeframes, while red indicators highlight potential misalignment or conflicting market signals.
Why it may be useful
The Candle Flip System provides traders with a structured approach to evaluating market conditions by simplifying multi-timeframe analysis. By offering a clear, visual representation of market bias across different timeframes, it helps traders make more informed and disciplined trading decisions.
This systematic method reduces emotional trading and encourages a more methodical evaluation of potential trade opportunities. Traders can quickly assess market alignment and make more confident entry decisions based on a comprehensive view of price action.
When to explore it
The Candle Flip System is most effective when traders want to validate their trading strategies across multiple timeframes before entering a trade. It works best in markets with clear trending characteristics, where multiple timeframe alignments can provide stronger signals.
Traders should use this system when seeking to reduce trading uncertainty and improve decision-making consistency. It is particularly useful for day and swing traders who want a structured method to assess market conditions before executing trades.
Keep exploring
What we’ve verified
Access, alerts and repainting behaviour have not been independently verified for this indicator. Check the creator’s current publication and settings.
General descriptions and classifications are recovered research. Verified details above identify the specific checks we have completed. Check the creator’s current publication for later changes.