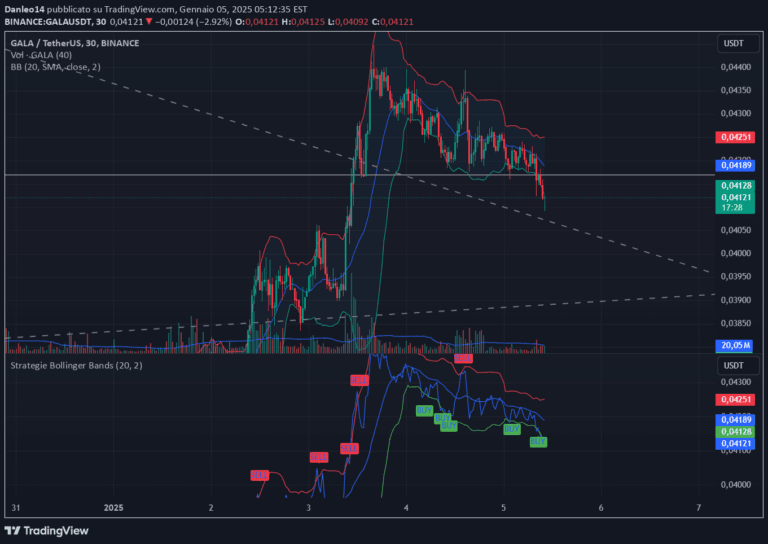
A volatility indicator that extends lines 3 times the candle range above the high and below the low, providing visual insights into potential price expansion zones.
Explore complementary indicator rolesHow it works
The Candle Range Extension indicator calculates the vertical range of each price candle by subtracting the low from the high. It then multiplies this range by a factor of 3 to create extended lines above and below the candle's extremes. These extension lines are plotted in green above the candle's high and red below the candle's low, creating visual markers for potential price movement boundaries.
By using a multiplier of 3, the indicator provides a dynamic method of identifying potential price expansion zones that adapt to each candle's unique volatility. This approach allows traders to quickly visualize potential price extension levels without relying on fixed or static reference points.
Why it may be useful
The Candle Range Extension indicator helps traders understand potential price volatility and movement ranges in real-time. By dynamically calculating extension lines based on each candle's actual range, it provides a flexible tool for assessing potential price expansion and contraction zones.
This can help traders make more informed decisions about entry, exit, and stop-loss placement. The visual representation of potential price ranges allows traders to quickly gauge market volatility and potential movement. The color-coded lines make it easy to identify upward and downward extension zones, providing an intuitive method for understanding potential price behavior.
When to explore it
The Candle Range Extension indicator works best in markets with consistent price movements and moderate volatility. It is particularly useful for traders who want a quick visual representation of potential price expansion zones. Traders can use this indicator to identify potential breakout levels, assess market volatility, and make more informed trading decisions.
This indicator is most effective for short-term trading strategies like scalping and day trading, where understanding immediate price movements is crucial. It can help traders set more dynamic stop-loss and take-profit levels based on the current candle's volatility, providing a flexible approach to risk management.
Keep exploring
What we’ve verified
Access, alerts and repainting behaviour have not been independently verified for this indicator. Check the creator’s current publication and settings.
General descriptions and classifications are recovered research. Verified details above identify the specific checks we have completed. Check the creator’s current publication for later changes.