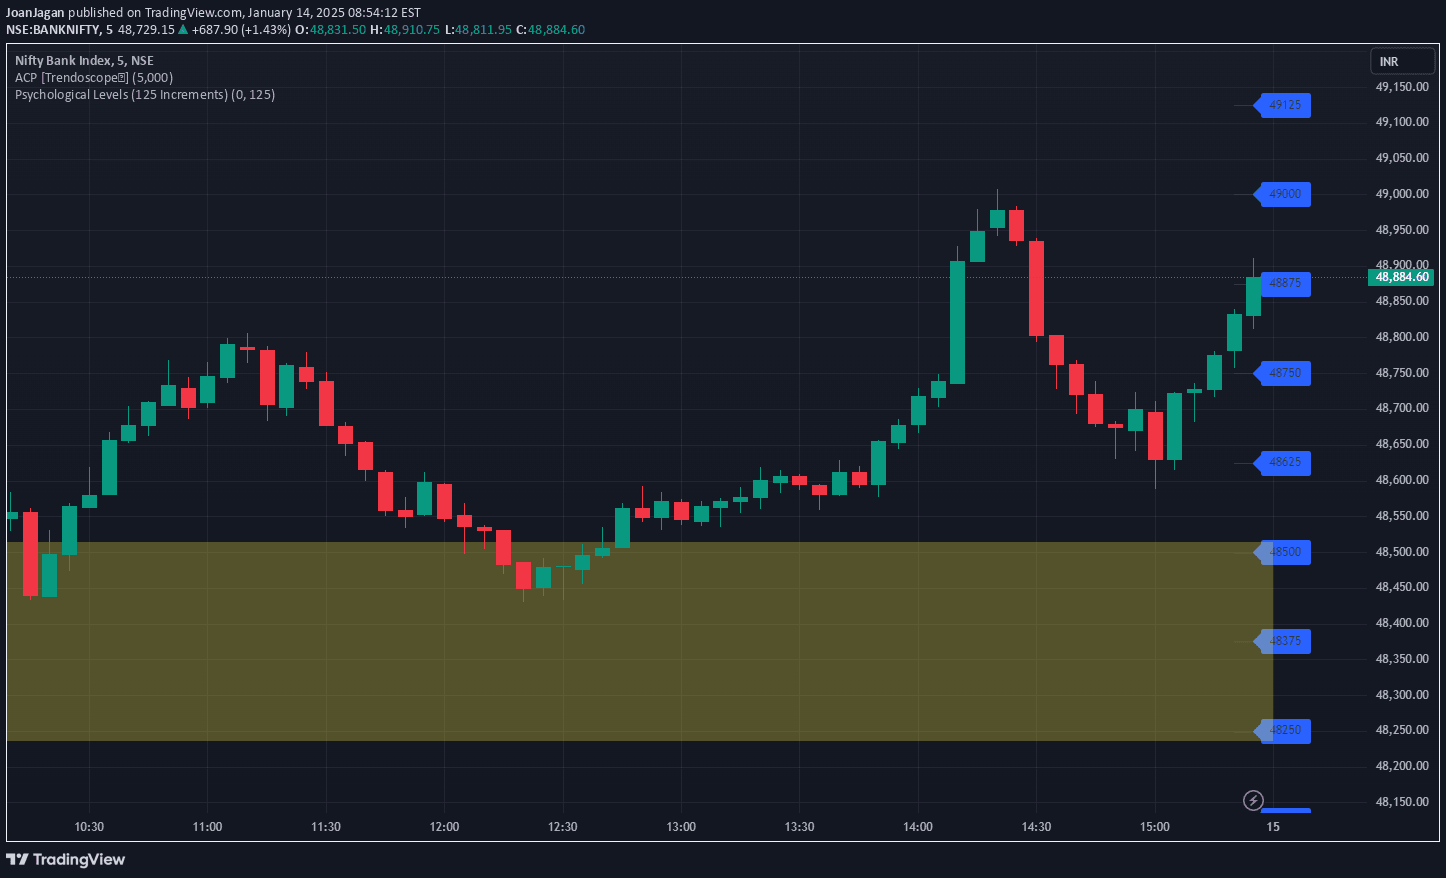
A gold trading indicator that draws psychological price levels every 50 pips, helping traders identify potential entry and pullback points with precision.
Explore complementary indicator rolesHow it works
The indicator focuses on identifying and marking psychological price levels in gold trading by drawing lines every 50 pips or $5 on the chart. These lines represent key price zones where retail traders typically enter or exit positions, which institutional traders often target for potential market movements.
By providing a visual representation of these critical price levels, traders can more easily recognize potential support and resistance zones. The lines serve as reference points for potential pullbacks and entries, allowing traders to make more informed decisions based on these psychologically significant price points.
Why it may be useful
Psychological price levels are crucial in trading because they represent points where many traders are likely to make decisions, creating potential market turning points or momentum shifts. By highlighting these levels, traders can gain insight into potential market behavior and anticipate possible price reactions.
The indicator helps traders move beyond purely technical analysis by incorporating the collective psychology of market participants. Understanding these levels can provide a strategic advantage, helping traders identify potential entry and exit points with greater precision and confidence.
When to explore it
This indicator is most effective when used in conjunction with other technical analysis tools, particularly on shorter timeframes like the 1-minute chart. It works best for traders looking to identify precise entry points during pullbacks in an established trend.
Traders should combine this indicator with momentum indicators for additional confirmation and use it as part of a comprehensive trading strategy. It is particularly useful for gold trading, where psychological levels can play a significant role in price movements.
Keep exploring
What we’ve verified
Access, alerts and repainting behaviour have not been independently verified for this indicator. Check the creator’s current publication and settings.
General descriptions and classifications are recovered research. Verified details above identify the specific checks we have completed. Check the creator’s current publication for later changes.