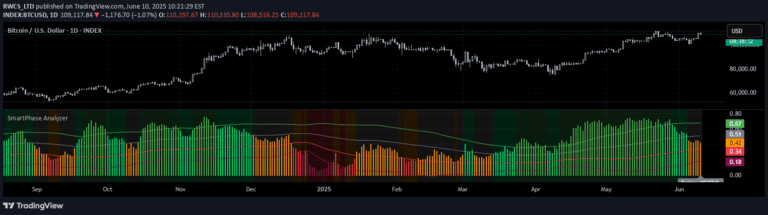
CAPM Alpha & Beta is an advanced financial indicator measuring an investment's risk-adjusted performance and market correlation, helping traders assess asset potential and portfolio dynamics.
Explore complementary indicator rolesHow it works
The CAPM Alpha & Beta indicator calculates two key metrics by comparing an asset's returns against market benchmarks. Alpha measures excess return by subtracting expected market-adjusted returns from actual returns, revealing the investment's performance beyond market movements.
Beta quantifies systematic risk by measuring an asset's price volatility relative to the overall market. It is computed through a mathematical ratio comparing the covariance of asset and market returns to market return variance, providing insights into how closely an investment tracks market trends.
Why it may be useful
This indicator offers crucial insights for investors by providing a comprehensive view of investment performance and risk characteristics. It helps traders understand not just raw returns, but the quality of those returns in relation to market conditions and inherent investment risks.
By revealing an asset's unique performance profile, Alpha & Beta enable more sophisticated investment decision-making. Investors can identify potentially undervalued assets, assess portfolio composition, and align investments with specific risk-return preferences more effectively.
When to explore it
CAPM Alpha & Beta are most beneficial when evaluating longer-term investment strategies and portfolio construction. They are particularly useful for investors seeking to understand the underlying risk dynamics of their investments beyond simple price movements.
These metrics work best when analyzing diversified portfolios, comparing different investment strategies, and making informed asset allocation decisions. They are especially valuable during periods of market transition or when assessing the potential of actively managed funds versus passive market indices.
Keep exploring
What we’ve verified
Access, alerts and repainting behaviour have not been independently verified for this indicator. Check the creator’s current publication and settings.
General descriptions and classifications are recovered research. Verified details above identify the specific checks we have completed. Check the creator’s current publication for later changes.