A Useful MA Weighting Function For Controlling Lag & Smoothness
A custom moving average using a beta distribution weighting function that allows traders to control lag and smoothness, offering flexible trend analysis with adjustable parameters.
Explore 11,183 indicators. Filter beyond the obvious.
Discover the tools that fit the way you trade.
11,183 tools to explore
A custom moving average using a beta distribution weighting function that allows traders to control lag and smoothness, offering flexible trend analysis with adjustable parameters.
A multi-asset performance indicator that tracks percentage changes across 30 symbols, offering comprehensive insights into asset performance, correlation, and market dynamics.
A parametric moving average with adjustable lag and overshoot, providing customizable trend analysis and potential reversal points using a modified sinewave kernel.
A statistical tool analyzing price and volume variations across multiple symbols using Z-Score metrics to identify market trends, outliers, and potential trading opportunities.
An advanced trading indicator combining Kalman Filtering and Supertrend to dynamically analyze market trends, detect price movements, and provide customizable trend signals with precision.
A comprehensive crypto market screener analyzing top 40 cryptocurrencies through multiple performance and risk metrics in an easy-to-read heatmap format.
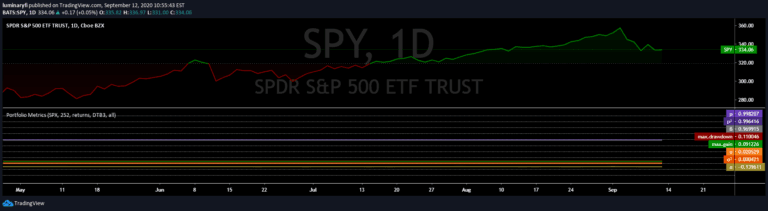
A comprehensive risk assessment tool that dynamically calculates multiple performance metrics, providing investors with adaptive insights into investment volatility, drawdown, and risk-adjusted returns.
Portfolio metrics provide comprehensive insights into investment performance, analyzing returns, risk, and statistical measures to evaluate portfolio health and potential investment strategies.
Rainbow Drift Beta is an EMA-based indicator that detects trend direction and potential entry points by analyzing multiple exponential moving averages across different timeframes.
An advanced MACD indicator using Holt-Winters smoothing to enhance trend detection and momentum analysis with real-time divergence detection and dynamic ATR-based trailing stops.
RSRS is a technical analysis tool that measures market strength by analyzing daily high and low prices through linear regression, generating trading signals based on calculated z-scores.
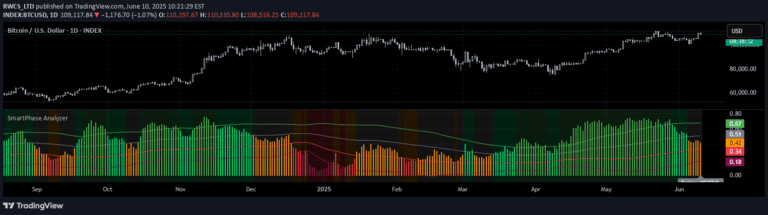
Advanced market regime classifier that analyzes multiple statistical indicators to generate a composite score, dynamically classifying market conditions across different states from bullish to bearish.
Likes, views, and comments are historical TradingView snapshots. They describe attention, not trading performance.