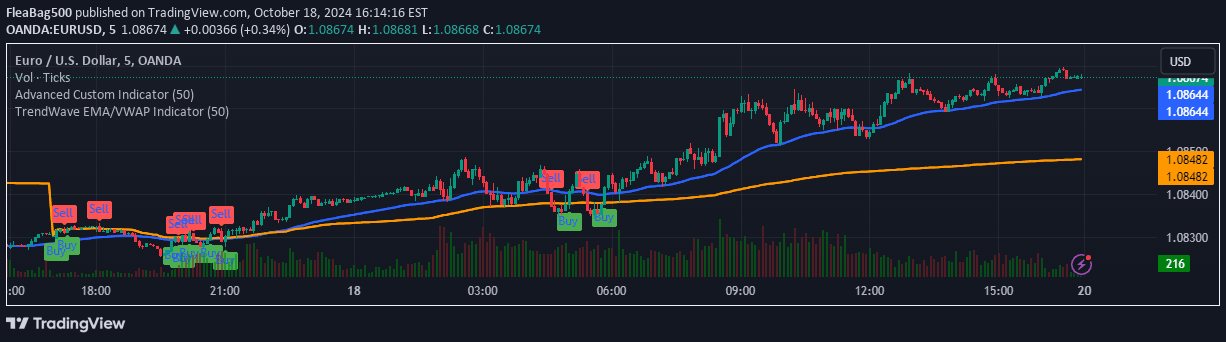
The Carlos Index combines EMA with recent price highs and lows to generate trend reversal signals, helping traders identify potential buy and sell opportunities across different market conditions.
Explore complementary indicator rolesHow it works
The Carlos Index uses a customizable Exponential Moving Average (EMA) to smooth price data and identify underlying market trends. It calculates the EMA over a default 20-period length, which can be adjusted by traders to suit their specific strategy and timeframe.
The indicator plots the highest and lowest prices over the last 8 periods, creating visual representations of recent market extremes. Buy and sell signals are generated when price crosses the EMA, with additional confirmation from comparing the current price to the previous period's price, adding an extra layer of signal validation.
Why it may be useful
The Carlos Index provides traders with a comprehensive market analysis tool that combines multiple technical indicators into a single, easy-to-interpret signal. By integrating EMA crossovers with recent price extremes, it offers a more nuanced approach to identifying potential trend reversals and market sentiment changes.
Its unique design helps reduce false signals by requiring multiple conditions to be met before generating a buy or sell alert. The indicator's flexibility allows traders to customize settings, making it adaptable across different trading styles, markets, and timeframes.
When to explore it
The Carlos Index is most effective in markets with clear trending characteristics, where price movements show consistent directional momentum. It performs particularly well in liquid markets with sufficient price action, such as major forex pairs, stock indices, and highly traded commodities.
Traders should use this indicator in conjunction with other technical and fundamental analysis tools to confirm signals and manage risk. It is especially useful during periods of market transition, helping identify potential trend reversals and providing early warning of significant price movement shifts.
Keep exploring
What we’ve verified
Access, alerts and repainting behaviour have not been independently verified for this indicator. Check the creator’s current publication and settings.
General descriptions and classifications are recovered research. Verified details above identify the specific checks we have completed. Check the creator’s current publication for later changes.