A Pine Script tool that analyzes percentage changes between price values, calculates true change, and provides customizable alerts for significant market movements.
Explore complementary indicator rolesHow it works
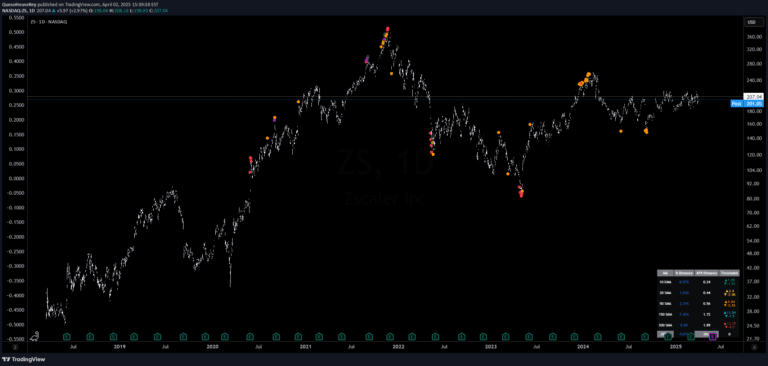
The Change Analysis and Alerts script calculates percentage changes between consecutive price points, focusing on closing prices as the primary reference. It computes the true change by comparing current and previous values, allowing traders to input custom comparison points like high-low or open-close ranges.
The script generates visual representations of these changes, typically using histograms or columns that display the magnitude of price variations. By setting custom thresholds, traders can configure alerts that trigger when percentage changes exceed predefined levels, enabling quick identification of significant market movements.
Why it may be useful
Understanding percentage changes helps traders quickly assess market dynamics and potential trend shifts by quantifying price movements with precise mathematical calculations. This approach provides a systematic method to evaluate market volatility and momentum beyond traditional visual analysis.
The script's flexibility in comparing different price points allows traders to gain deeper insights into market behavior, revealing subtle changes that might not be immediately apparent through standard chart interpretation. By transforming raw price data into meaningful percentage changes, traders can make more informed decisions based on objective measurements.
When to explore it
The Change Analysis and Alerts script is most effective during periods of market transition, where identifying subtle price movements can signal potential trend reversals or emerging momentum. Traders can utilize this tool during volatile market conditions to capture rapid price changes across different timeframes.
It is particularly useful for short-term trading strategies that require rapid decision-making, such as scalping and day trading. Traders can customize thresholds to match their specific risk tolerance and trading style, making it adaptable to various market conditions and individual trading preferences.
Keep exploring
What we’ve verified
Access, alerts and repainting behaviour have not been independently verified for this indicator. Check the creator’s current publication and settings.
General descriptions and classifications are recovered research. Verified details above identify the specific checks we have completed. Check the creator’s current publication for later changes.