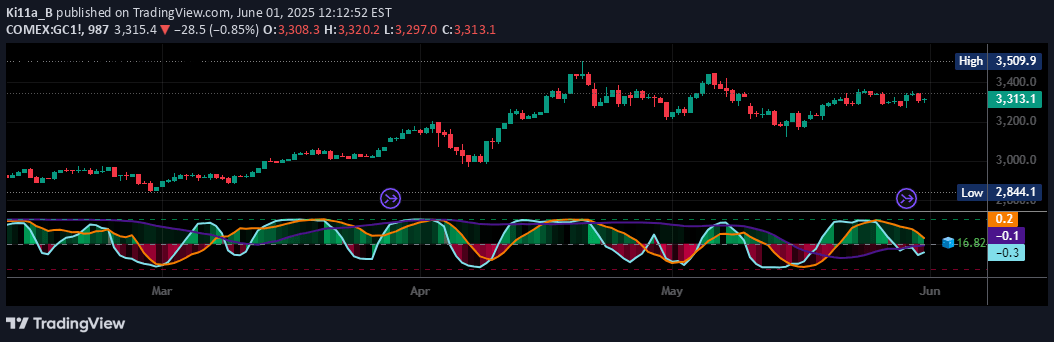
A price change analysis tool that calculates click, percentage change, and Z-score to identify market movements and potential outliers using statistical methods.
Explore complementary indicator rolesHow it works
The indicator begins by calculating the absolute price change between consecutive periods, tracking the raw movement in price. It then computes the percentage change, which provides a relative perspective on price movement by comparing the current price to the previous price.
The Z-score calculation is the core statistical component, standardizing price changes by measuring how many standard deviations an observation is from the mean. This allows traders to understand whether a price movement is typical or represents an unusual market event, helping to identify potential outliers or significant market shifts.
Why it may be useful
By providing multiple perspectives on price movement, this indicator helps traders understand market dynamics beyond simple price tracking. The absolute price change gives a direct view of market movement, while percentage change normalizes this movement relative to the previous price.
The Z-score adds a sophisticated statistical layer, enabling traders to distinguish between normal market fluctuations and potentially significant price movements. This multi-dimensional approach provides deeper insights into market behavior, helping traders make more informed decisions about potential trading opportunities.
When to explore it
This indicator is most effective during periods of market volatility where understanding the magnitude and statistical significance of price movements is crucial. It works particularly well in markets with high liquidity and frequent price changes, such as forex, cryptocurrencies, and actively traded stocks.
Traders should use this tool when seeking to identify unusual market events, potential trend reversals, or anomalous price behaviors. It is especially useful for short-term trading strategies that rely on quick identification of market movements and statistical outliers.
Keep exploring
What we’ve verified
Access, alerts and repainting behaviour have not been independently verified for this indicator. Check the creator’s current publication and settings.
General descriptions and classifications are recovered research. Verified details above identify the specific checks we have completed. Check the creator’s current publication for later changes.