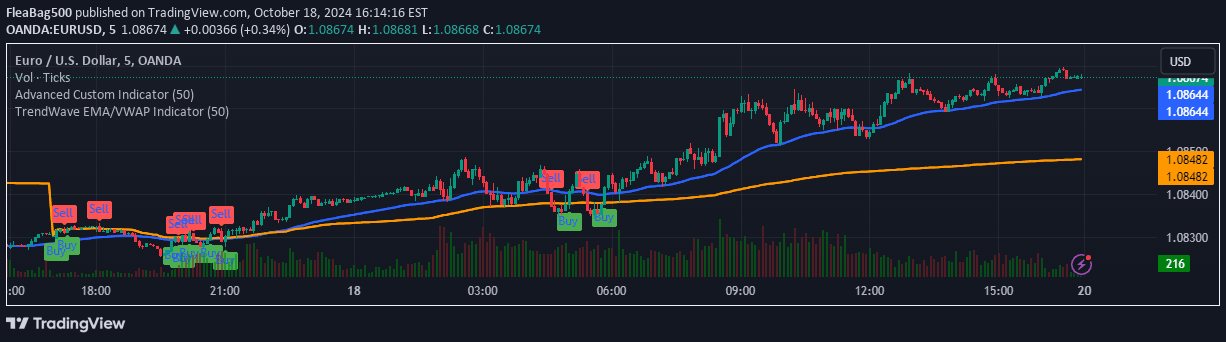
The Closest Candle to EMA (CCE) indicator identifies the historical price candle closest to the current Exponential Moving Average, helping traders analyze price-trend interactions.
Explore complementary indicator rolesHow it works
The indicator first calculates an Exponential Moving Average (EMA) using a user-defined length, typically defaulting to 20 periods. It then scans the most recent candles equal to the EMA length to find the specific candle whose closing price is mathematically closest to the current EMA value.
Once identified, the closest candle is visually highlighted in red, while the EMA line is displayed in blue. This process allows traders to quickly understand how recent price action has interacted with the current trend line, providing a quick visual representation of price convergence and potential mean reversion points.
Why it may be useful
The CCE indicator offers traders a unique perspective on price-trend dynamics by highlighting the most representative candle relative to the current trend. It helps traders understand how closely recent price action has tracked the moving average, which can provide insights into market momentum and potential trend strength.
By visualizing the closest candle to the EMA, traders can more easily identify potential support and resistance levels, assess trend continuity, and make more informed decisions about market entry and exit points. This tool bridges the gap between raw price action and trend analysis, making complex market movements more interpretable.
When to explore it
The CCE indicator is most effective in markets with clear trending behavior, where price tends to oscillate around a central moving average. It works particularly well in markets with moderate volatility, where price movements are not extremely erratic or choppy, allowing for more meaningful trend analysis.
Traders can utilize this indicator during consolidation phases, trend identification, and when searching for potential mean reversion opportunities. It is especially useful for traders who employ price action strategies, want to confirm trend strength, or need a quick visual tool to understand recent price behavior relative to the trend line.
Keep exploring
What we’ve verified
Access, alerts and repainting behaviour have not been independently verified for this indicator. Check the creator’s current publication and settings.
General descriptions and classifications are recovered research. Verified details above identify the specific checks we have completed. Check the creator’s current publication for later changes.