
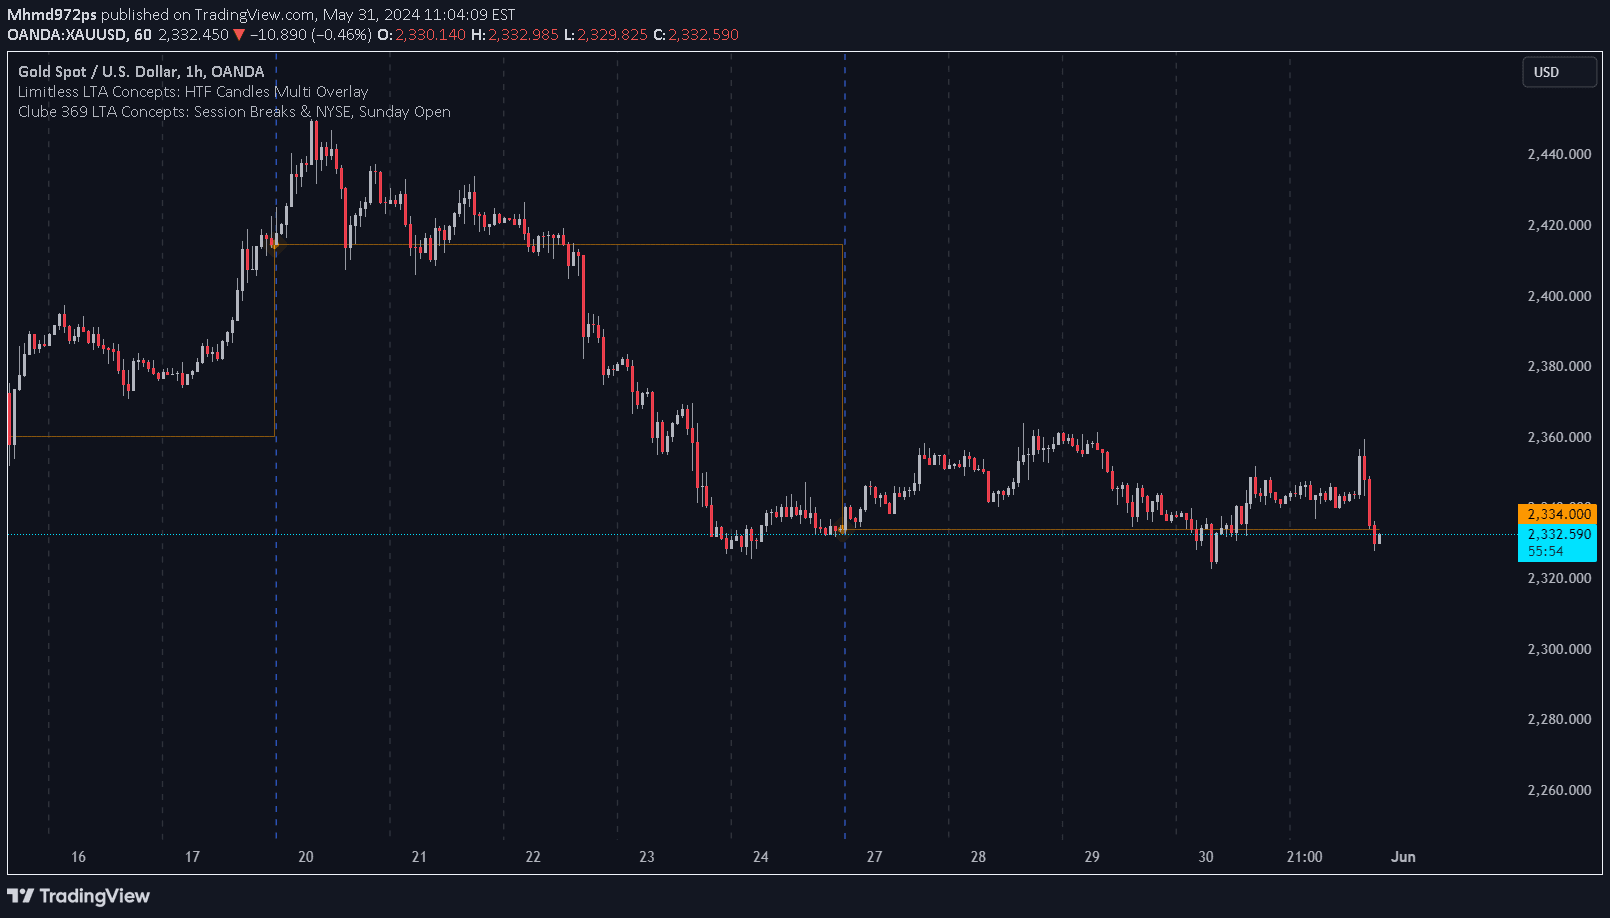
A trading tool that marks significant market timestamps and tracks the Sunday opening price, providing visual references for market timing and potential trend analysis.
Explore complementary indicator rolesHow it works
The Limitless LTA indicator functions by generating vertical lines on the chart to highlight specific times of interest, typically at 18:00 PM UTC-5 over the previous four days. These vertical markers serve as visual timestamps to help traders quickly identify key market moments and temporal reference points.
Additionally, the indicator plots a line representing the first candle's price at the start of the trading week, usually on Sunday. This Sunday open price line provides traders with a consistent baseline for comparing subsequent market movements and understanding initial weekly market sentiment.
Why it may be useful
The indicator offers traders a strategic visual tool for understanding market timing and potential trend dynamics by providing clear, consistent markers for important trading timestamps. By displaying vertical lines and a Sunday open price, it helps traders quickly orient themselves within the market's temporal context and identify potential strategic entry or exit points.
Moreover, these visual references can enhance a trader's market awareness, allowing for more informed decision-making by providing immediate insights into market structure and potential trend initiation points across different timeframes.
When to explore it
The Limitless LTA indicator is most effective for traders seeking to understand market timing and weekly price dynamics, particularly those interested in tracking the initial market sentiment at the week's start. It is particularly useful for traders who want to establish a consistent reference point for analyzing market movements and potential trend directions.
Traders can benefit most from this tool when looking to develop a structured approach to market analysis, especially those trading across multiple timeframes who want a clear, visual representation of key market timestamps and the initial weekly price context.
Keep exploring
What we’ve verified
Access, alerts and repainting behaviour have not been independently verified for this indicator. Check the creator’s current publication and settings.
General descriptions and classifications are recovered research. Verified details above identify the specific checks we have completed. Check the creator’s current publication for later changes.


