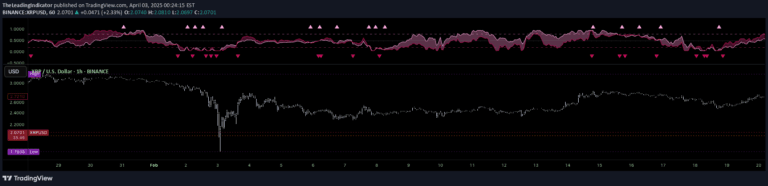
A comprehensive market sentiment indicator that combines seven fundamental components to gauge investor emotions and potential market movements across different financial metrics.
Explore complementary indicator rolesHow it works
The CNN Fear and Greed Index aggregates seven key market indicators through a sophisticated normalization and weighting process. Each component, including stock price momentum, stock price strength, market volatility, and options ratio, is transformed into a normalized score between 0 and 100.
The index then calculates a weighted average of these normalized components, creating a single numerical representation of market sentiment. Traders can customize the weights of each component, allowing for personalized interpretation of market conditions based on individual trading strategies and insights.
Why it may be useful
The Fear and Greed Index provides traders with a holistic view of market sentiment by integrating multiple complex financial indicators into a single, digestible metric. By capturing nuanced market emotions, it helps traders understand underlying market psychology and potential trend reversals before they become obvious.
This comprehensive approach allows investors to make more informed decisions, identifying potential overbought or oversold conditions and understanding the broader market context. The index serves as a valuable tool for risk management, helping traders anticipate market shifts and adjust their strategies proactively.
When to explore it
The Fear and Greed Index is most effective during periods of market uncertainty or significant economic transitions, where investor sentiment can rapidly change. It provides valuable insights during market turning points, helping traders identify potential trend reversals and shifts in market dynamics.
Traders should use this indicator in conjunction with other technical and fundamental analysis tools, particularly when making decisions about market entry, exit, and risk management. It is especially useful for understanding broader market trends across different timeframes, from short-term scalping to longer-term swing trading strategies.
Keep exploring
What we’ve verified
Access, alerts and repainting behaviour have not been independently verified for this indicator. Check the creator’s current publication and settings.
General descriptions and classifications are recovered research. Verified details above identify the specific checks we have completed. Check the creator’s current publication for later changes.