
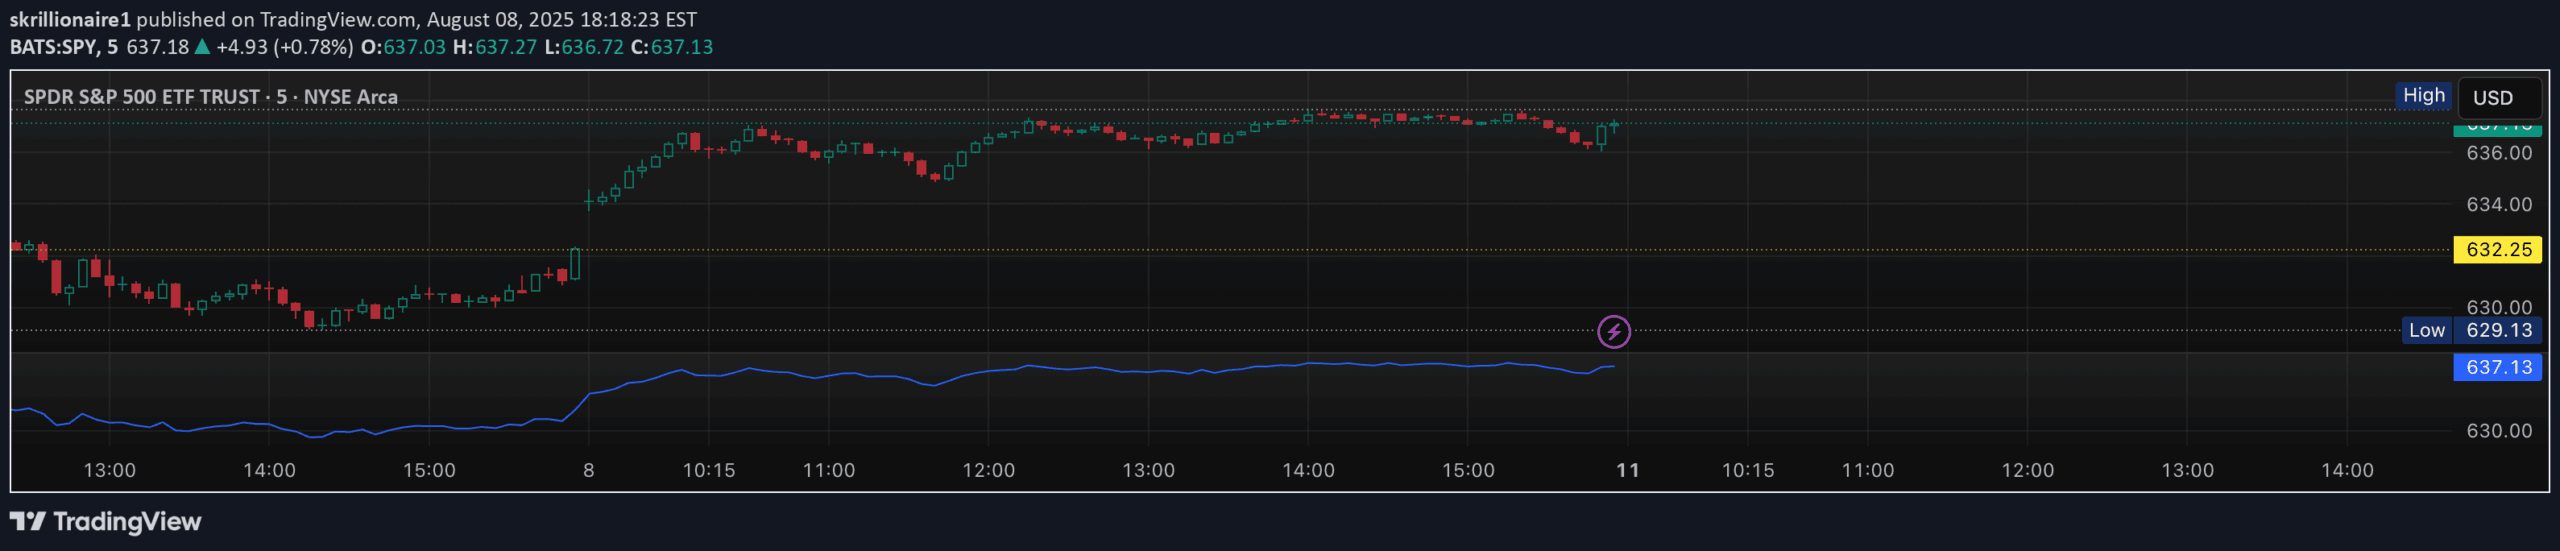
A comprehensive technical analysis indicator combining multiple tools like EMAs, MACD, PSAR, RSI, and Bollinger Bands to provide a holistic view of market conditions and potential trading signals.
Explore complementary indicator rolesHow it works
The indicator calculates multiple technical indicators simultaneously, using exponential moving averages, MACD, PSAR, RSI, Bollinger Bands, and ADX. It compares different moving averages to detect potential trend changes and crossovers.
The script assigns color-coded signals based on each indicator's current state, creating a visual representation of market dynamics. Each component is calculated using specific mathematical formulas and compared against predefined thresholds to determine bullish, bearish, or neutral conditions
Why it may be useful
Traders benefit from a multi-dimensional analysis that reduces complex market information into easily digestible visual signals. By integrating various technical indicators, the script provides a more comprehensive market assessment than single-indicator approaches.
It helps traders quickly identify potential trend changes, momentum shifts, and market sentiment. The color-coded system allows for rapid interpretation of multiple market factors, potentially improving decision-making speed and accuracy
When to explore it
This indicator works best during periods of moderate market volatility across various asset classes. It is particularly useful for traders seeking a holistic view of market conditions before making trading decisions.
The tool is most effective when used on liquid markets with clear trending or ranging behaviors. Traders should combine these signals with other fundamental analysis and risk management strategies. Performance may vary across different market environments and asset types
Keep exploring
What we’ve verified
Access, alerts and repainting behaviour have not been independently verified for this indicator. Check the creator’s current publication and settings.
General descriptions and classifications are recovered research. Verified details above identify the specific checks we have completed. Check the creator’s current publication for later changes.


