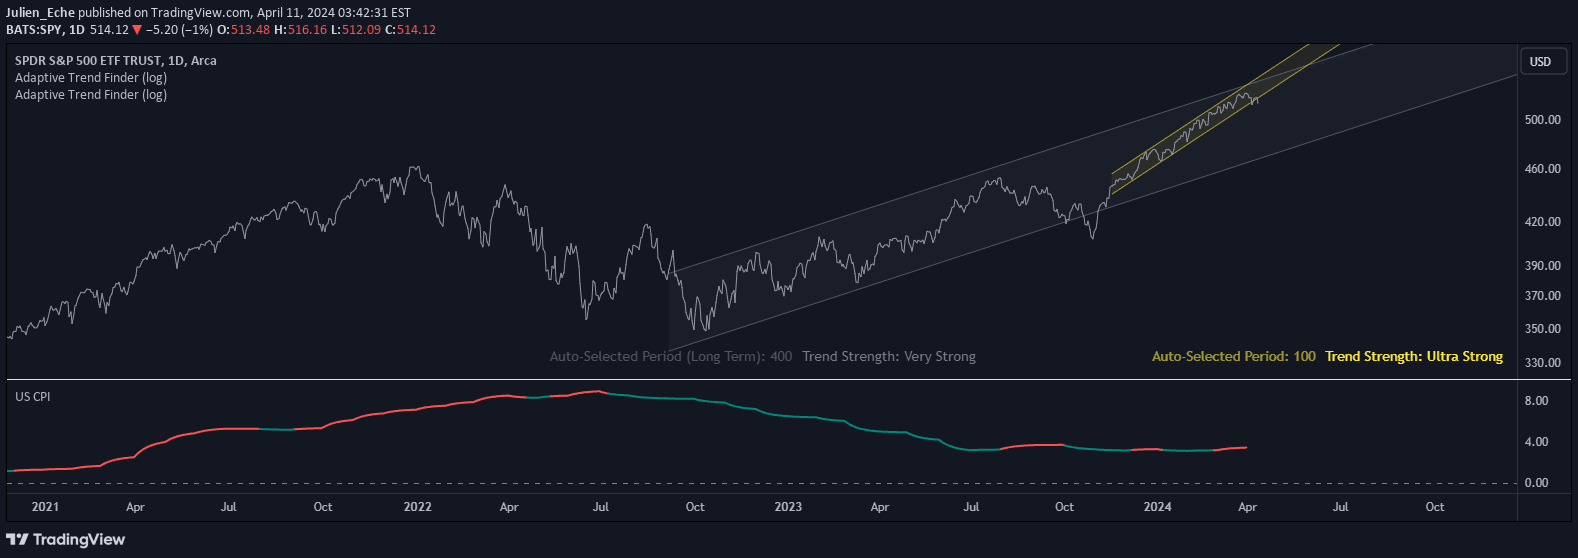
A comparative inflation analysis tool that measures CPI changes between two economic regions to identify potential currency trading opportunities and monetary policy trends.
Explore complementary indicator rolesHow it works
The CPI Comparison Signal calculates the annual inflation rate changes for two selected economic zones using a specified time period ranging from 3 to 12 months. By comparing the Consumer Price Index variations between regions like the EU, USA, and UK, traders can derive insights into relative economic performance and potential monetary policy shifts.
The indicator computes the percentage change in CPI for each region and then determines the differential between these changes. This differential can signal potential divergences in economic conditions, which might influence currency exchange rates and central bank decision-making processes.
Why it may be useful
The CPI Comparison Signal provides traders with a nuanced macroeconomic perspective on inflation dynamics across different economic regions. By highlighting differences in inflation rates, the indicator helps traders anticipate potential currency movements and understand broader economic trends that could impact financial markets.
Monetary policy decisions are heavily influenced by inflation data, making this signal crucial for predicting potential interest rate changes. Traders can use these insights to make more informed decisions about currency pair trades, potentially identifying opportunities for speculation based on emerging economic differentials.
When to explore it
The CPI Comparison Signal is most effective during periods of significant economic uncertainty or when substantial monetary policy shifts are anticipated. Traders should utilize this indicator when comparing economies with different growth trajectories and monetary approaches, such as developed versus emerging markets.
The signal works best when combined with other technical and fundamental analysis tools, providing a comprehensive view of potential trading opportunities. It is particularly valuable during global economic events, central bank announcements, and periods of heightened international economic interaction.
Keep exploring
What we’ve verified
Access, alerts and repainting behaviour have not been independently verified for this indicator. Check the creator’s current publication and settings.
General descriptions and classifications are recovered research. Verified details above identify the specific checks we have completed. Check the creator’s current publication for later changes.