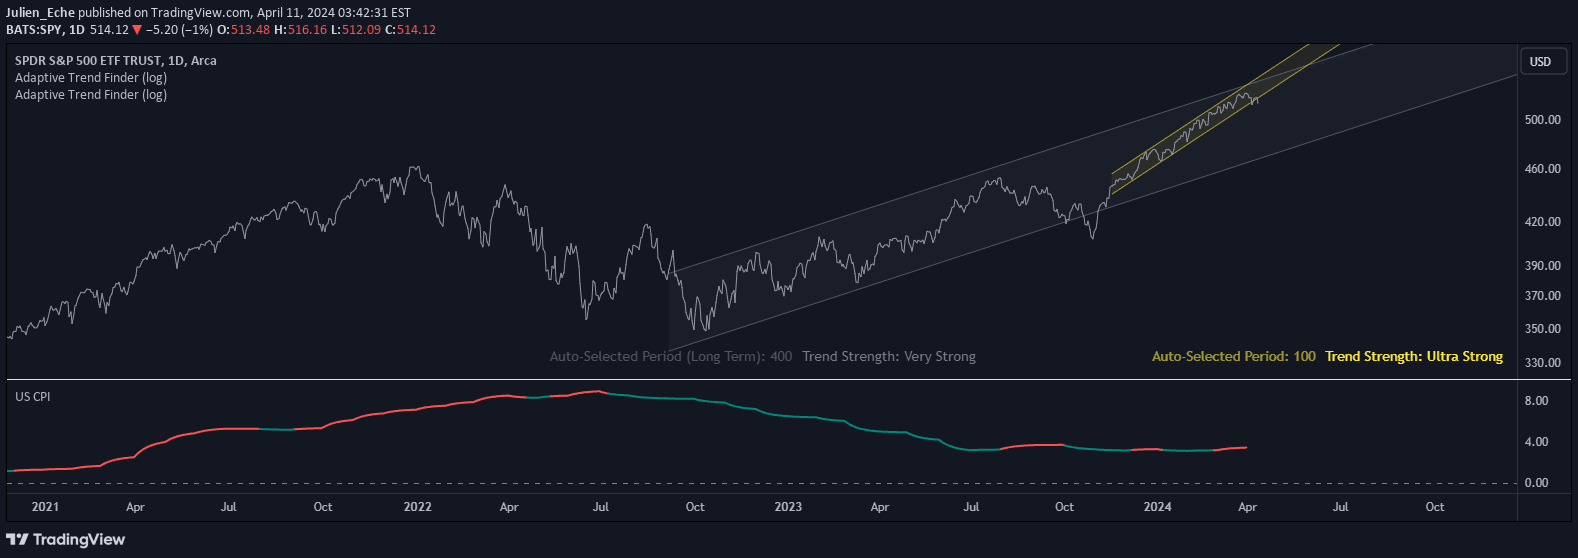
A CPI signal that compares current and historical inflation values, featuring a max inflation rate parameter to help traders visualize base effects and inflation trends.
Explore complementary indicator rolesHow it works
The CPI signal tracks inflation by comparing current Consumer Price Index values with those from a year ago, enabling traders to understand inflation dynamics. It displays historical and current CPI values side-by-side, making base effects more visually apparent and easier to interpret.
The signal includes a customizable max inflation rate parameter, represented by a red line on the chart. This line serves as a threshold, helping traders quickly assess whether inflation is staying within acceptable limits or potentially exceeding predefined boundaries.
Why it may be useful
The CPI signal provides crucial economic context for trading decisions by offering a clear visualization of inflation trends and their potential market impacts. It helps traders understand how price levels are changing over time, which can significantly influence investment strategies and asset allocation.
By presenting a max inflation rate parameter, the signal offers a straightforward way to monitor economic health and potential market risks. Traders can use this information to make more informed decisions about portfolio management and potential market shifts.
When to explore it
The CPI signal is most effective when analyzing long-term economic trends and assessing potential market conditions influenced by inflation. It is particularly useful for traders interested in macroeconomic indicators and their potential impact on financial markets.
Traders should utilize this signal when conducting fundamental analysis, considering economic policy changes, or evaluating broader market trends. It is especially valuable for swing traders and investors who are interested in understanding long-term economic cycles and potential market movements.
Keep exploring
What we’ve verified
Access, alerts and repainting behaviour have not been independently verified for this indicator. Check the creator’s current publication and settings.
General descriptions and classifications are recovered research. Verified details above identify the specific checks we have completed. Check the creator’s current publication for later changes.