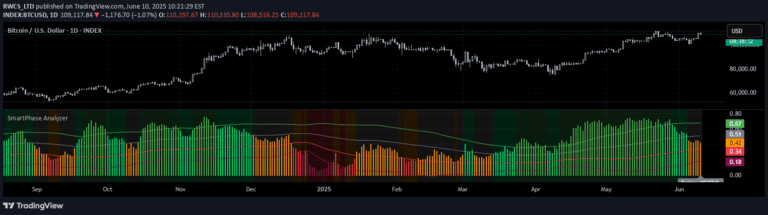
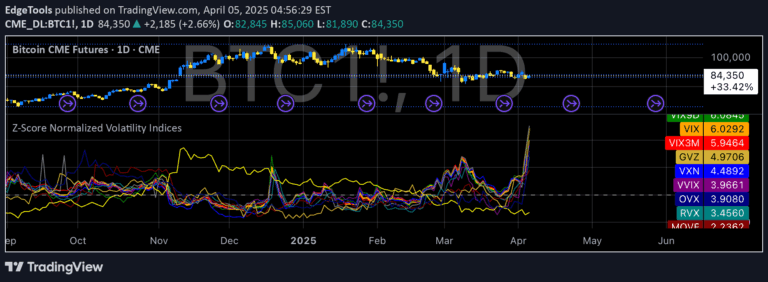
Rolling CAGR tracks the mean annual growth rate of an investment over time, measuring sustained performance through compounding returns across a customizable period.
Explore complementary indicator rolesHow it works
The Rolling CAGR calculates the compound annual growth rate by analyzing the percentage change in value over a specified time period. It uses a formula that compares the end value to the start value, raised to the power of one divided by the number of years, then subtracts one to determine the annualized return.
Traders can customize the lookback period, typically selecting between 1-5 years, and choose different data sources like closing prices. The indicator automatically adjusts for trading days per year, using 252 for stocks and 365 for cryptocurrency markets, providing a standardized method of comparing investment performance.
Why it may be useful
The Rolling CAGR provides traders with a comprehensive view of long-term investment performance, smoothing out short-term market fluctuations to reveal sustained growth trends. By presenting returns in an annualized format, it allows for direct comparisons between different assets, investment strategies, and time periods.
This indicator helps investors understand the true compounded growth of an asset, revealing performance beyond simple point-to-point calculations. It offers insights into an investment's consistent earning potential, helping traders make more informed decisions about asset allocation and potential future returns.
When to explore it
The Rolling CAGR is most effective when analyzing investments over extended periods, typically spanning multiple years. It works best with assets that have consistent, long-term price data and are suited to swing trading or investment strategies focused on sustained growth.
Traders should utilize this indicator when comparing different assets, evaluating portfolio performance, or seeking to understand the underlying growth trajectory of an investment. It is particularly useful for fundamental analysis, portfolio management, and long-term investment strategy development.
Keep exploring
What we’ve verified
Access, alerts and repainting behaviour have not been independently verified for this indicator. Check the creator’s current publication and settings.
General descriptions and classifications are recovered research. Verified details above identify the specific checks we have completed. Check the creator’s current publication for later changes.