
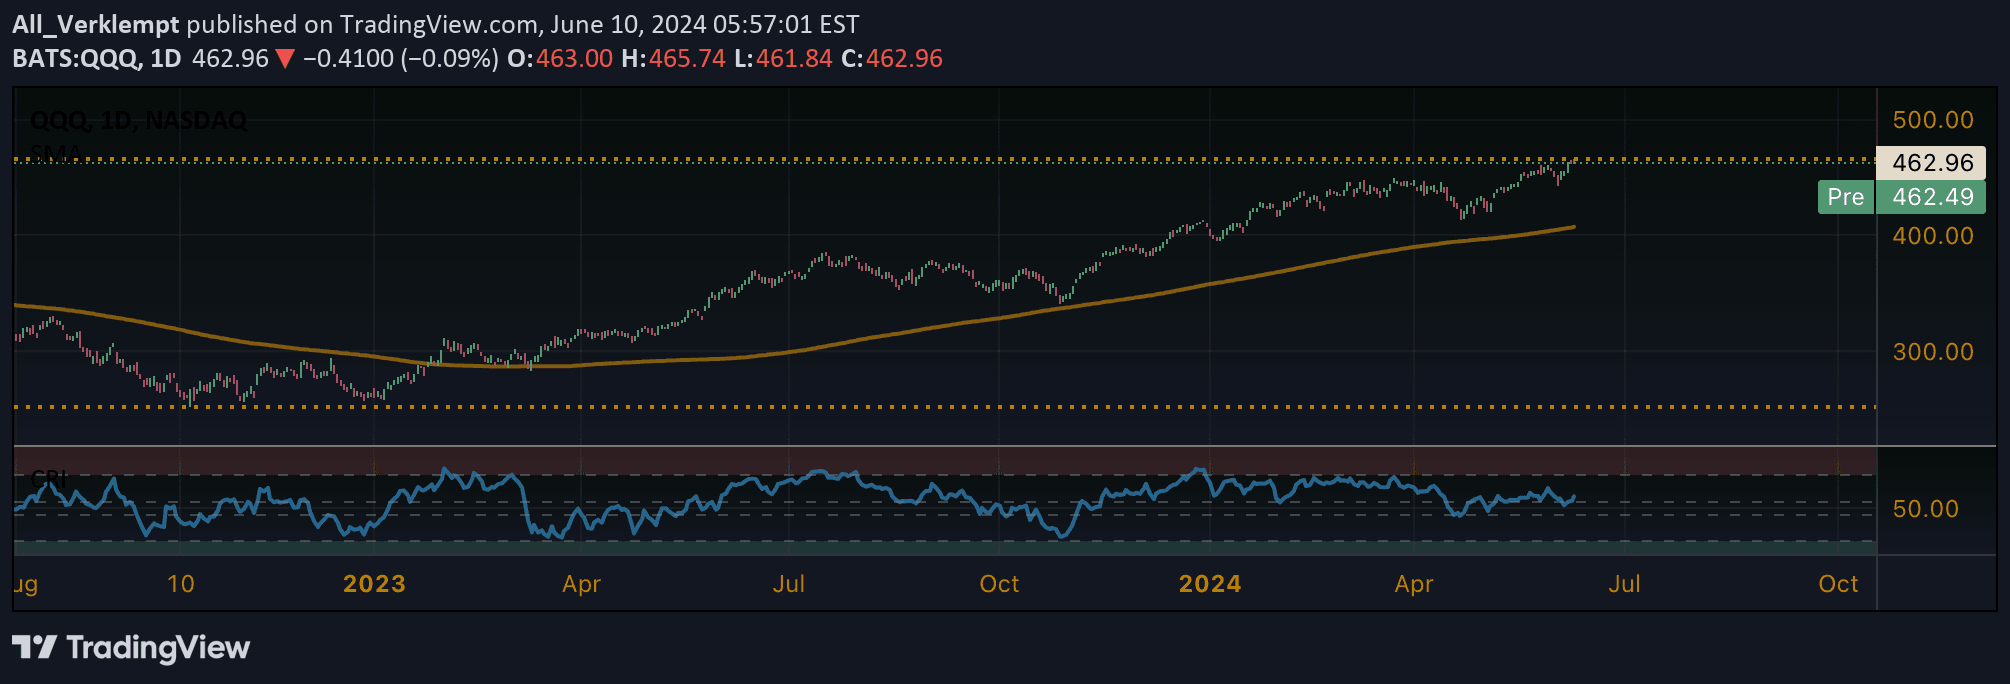
A comprehensive financial tool that synthesizes six key market spreads to assess overall market risk and sentiment across different asset classes and investment sectors.
Explore complementary indicator rolesHow it works
The Composite Risk Indicator calculates risk by comparing performance spreads across six distinct market segments, including stock versus bond markets, different bond quality levels, and varying stock categories. Each spread is mathematically normalized to a 0-100 scale, allowing for a standardized comparative analysis.
By tracking relative performance between these asset classes, the indicator creates a comprehensive risk profile that reveals underlying market dynamics. The six key spreads - ranging from stock market performance to sector-specific comparisons - are aggregated into a single metric that reflects current market sentiment and risk tolerance.
Why it may be useful
The Composite Risk Indicator provides traders and investors with a sophisticated, multi-dimensional view of market risk that goes beyond traditional single-metric assessments. By synthesizing information across multiple asset classes and investment sectors, it offers a more holistic understanding of market conditions and potential investment opportunities.
This comprehensive approach allows investors to make more informed decisions by identifying subtle shifts in market sentiment, risk appetite, and potential sector rotations. The indicator's ability to capture nuanced market dynamics makes it a powerful tool for risk management and strategic investment planning.
When to explore it
The Composite Risk Indicator is most effective during periods of market transition, when investors are seeking to understand underlying economic shifts and sentiment changes. It is particularly valuable during times of economic uncertainty, market rotation, or when significant macroeconomic events might impact multiple asset classes.
Traders can utilize this indicator to assess overall market risk, identify potential sector opportunities, and adjust their investment strategies accordingly. It is especially useful for portfolio managers, institutional investors, and sophisticated individual traders who require a comprehensive view of market conditions beyond traditional technical analysis.
Keep exploring
What we’ve verified
Access, alerts and repainting behaviour have not been independently verified for this indicator. Check the creator’s current publication and settings.
General descriptions and classifications are recovered research. Verified details above identify the specific checks we have completed. Check the creator’s current publication for later changes.


