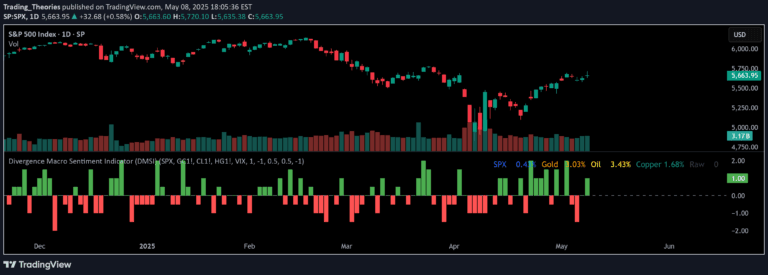
Confluence Strategy combines multiple technical indicators and chart patterns to identify high-probability trading opportunities by ensuring multiple signals align before making a trade decision.
Explore complementary indicator rolesHow it works
The Confluence Strategy works by integrating multiple technical analysis tools to validate trading signals. Traders analyze moving averages, RSI, MACD, support and resistance levels, and chart patterns simultaneously to confirm potential market movements.
By looking for agreement between different indicators, traders create a more robust decision-making process. Each indicator provides a different perspective on market conditions, and when they collectively suggest the same potential price action, the probability of a successful trade increases significantly.
Why it may be useful
The Confluence Strategy matters because it reduces the risk of false signals by requiring multiple confirmations before entering a trade. This approach helps traders make more informed decisions by considering various technical analysis perspectives and market dynamics.
By combining different indicators and analysis techniques, traders can develop a more comprehensive understanding of market trends and potential price movements. This method helps minimize emotional trading and provides a more disciplined, systematic approach to identifying high-probability trading opportunities.
When to explore it
The Confluence Strategy is most effective in markets with clear trends and sufficient volatility. It works best when traders can identify multiple technical signals converging at key price levels, such as support and resistance zones or during potential trend reversals.
Traders should use this strategy when they want to increase their trading accuracy and reduce the likelihood of entering trades based on single, potentially unreliable signals. It is particularly useful in markets with well-defined trends and when multiple technical indicators provide consistent, complementary information about potential price movements.
Keep exploring
What we’ve verified
Access, alerts and repainting behaviour have not been independently verified for this indicator. Check the creator’s current publication and settings.
General descriptions and classifications are recovered research. Verified details above identify the specific checks we have completed. Check the creator’s current publication for later changes.