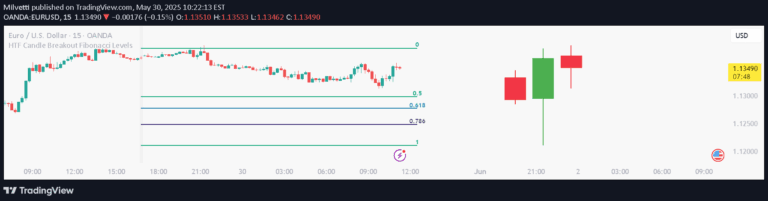
A trading indicator that automatically identifies and highlights market consolidation zones, helping traders spot potential price breakout opportunities with customizable detection parameters.
Explore complementary indicator rolesHow it works
The Consolidation Boxes Indicator works by analyzing price action across multiple candles to detect periods of market indecision. It automatically scans the price chart and identifies when multiple candles are closing within a tight range, signaling a potential consolidation zone.
Once a consolidation zone is detected, the indicator draws a shaded box around the price range, dynamically extending the box as long as price remains within the defined area. When price breaks above or below the box, the indicator can trigger an alert, signaling a potential trade entry point based on the breakout.
Why it may be useful
Consolidation zones are critical moments in trading where market participants are uncertain about future price direction, creating potential opportunities for strategic entries. By automatically highlighting these zones, traders can quickly identify periods of market indecision without manually scanning charts.
The indicator reduces subjective analysis by providing an objective, rules-based approach to detecting consolidation. This helps traders filter out noise, focus on high-probability setups, and make more informed trading decisions across different markets and timeframes.
When to explore it
The Consolidation Boxes Indicator is most effective in markets with clear trending or ranging characteristics, where price tends to move in distinct phases of consolidation and breakout. It works particularly well in liquid markets like forex, stocks, and cryptocurrencies where price movements are more predictable.
Traders should use this indicator in conjunction with other technical analysis tools like volume indicators, momentum oscillators, or trend-following signals to validate potential breakout opportunities. It's especially useful for traders seeking to anticipate volatility after periods of price compression.
Keep exploring
What we’ve verified
Access, alerts and repainting behaviour have not been independently verified for this indicator. Check the creator’s current publication and settings.
General descriptions and classifications are recovered research. Verified details above identify the specific checks we have completed. Check the creator’s current publication for later changes.