A trading indicator that adds price levels at constant multiples based on earnings metrics, helping traders assess stock valuation and potential undervaluation quickly.
Explore complementary indicator rolesHow it works
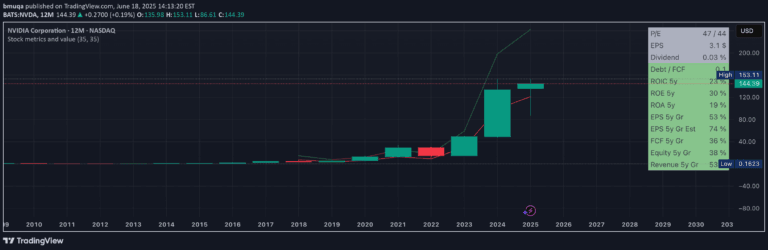
This indicator calculates price levels by using historical earnings data, specifically operational income as the default metric. It creates multiple price levels based on a constant multiple of the chosen earnings metric. The script plots these levels directly on the price chart to provide a visual representation of stock valuation.
By comparing current stock price against these calculated levels, traders can quickly assess potential undervaluation. The levels are generated using historical data, creating a reference point for stock pricing. The indicator allows customization of the valuation metric based on trader preference
Why it may be useful
This indicator provides traders with a quick and straightforward method to evaluate stock valuation relative to earnings. It offers an immediate visual tool for assessing whether a stock might be underpriced or overpriced. By using earnings metrics, traders can make more informed investment decisions based on fundamental analysis.
The indicator helps identify potential investment opportunities by highlighting stocks trading below their historical earnings multiples. It serves as a preliminary screening tool for value investors seeking undervalued stocks. The flexibility in metric selection allows traders to adapt the analysis to their specific investment strategy
When to explore it
This indicator works best during periods of stable earnings and consistent financial performance. It is most effective for long-term investors and swing traders interested in fundamental valuation. The signal is particularly useful when analyzing stocks with predictable earnings histories.
Traders should use this indicator as an initial screening tool, not a definitive investment signal. It is most valuable when combined with other technical and fundamental analysis methods. The indicator is especially helpful during market corrections or when seeking value investments. Traders should be cautious and conduct additional research beyond these price levels
Keep exploring
What we’ve verified
Access, alerts and repainting behaviour have not been independently verified for this indicator. Check the creator’s current publication and settings.
General descriptions and classifications are recovered research. Verified details above identify the specific checks we have completed. Check the creator’s current publication for later changes.