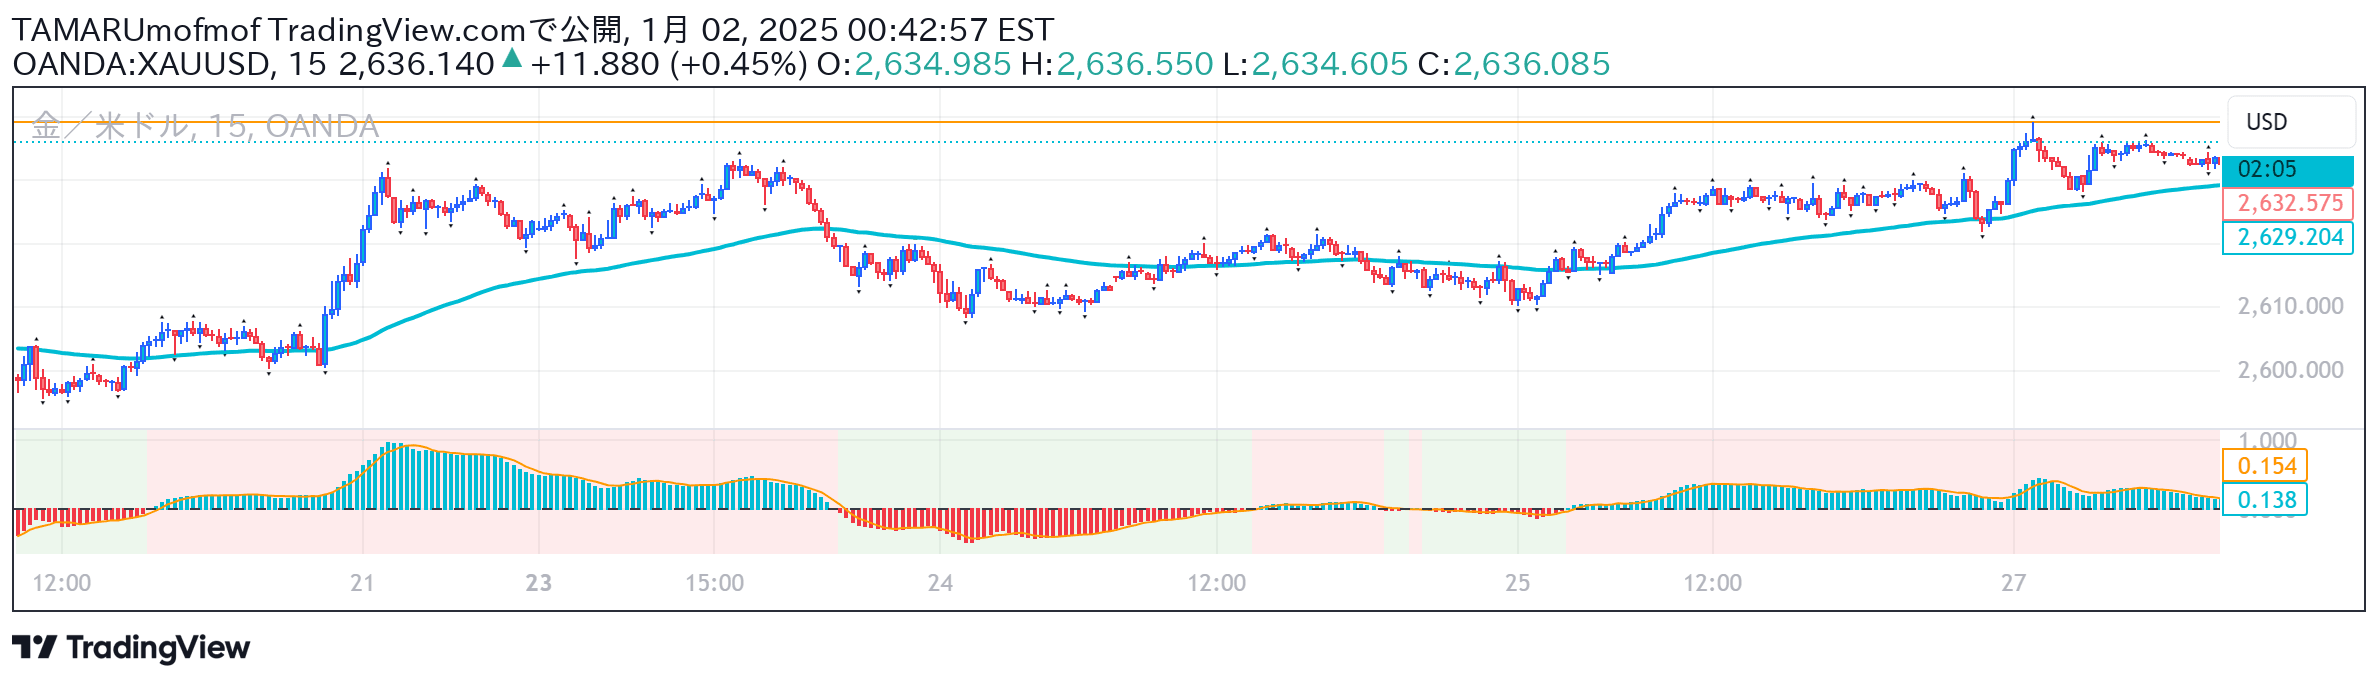
The Coppock Curve is a long-term technical indicator that identifies market turning points by analyzing 14-month and 11-month rates of change through a weighted moving average.
Explore complementary indicator rolesHow it works
The Coppock Curve calculates rates of change for 14 and 11 periods, then sums these values. A 10-period weighted moving average is applied to this sum, creating a smoothed momentum indicator. It tracks the market's long-term momentum by measuring the rate of price changes over multiple months.
The curve oscillates around a zero line, providing visual insights into market momentum. Crossovers above or below zero signal potential trend shifts. The indicator smooths out short-term market noise to focus on broader market movements
Why it may be useful
The Coppock Curve helps investors identify major market turning points and potential long-term trend reversals. It provides a systematic approach to understanding market momentum beyond short-term fluctuations. By focusing on longer-term price changes, traders can make more informed investment decisions.
The indicator helps reduce emotional trading by offering objective momentum signals. It can highlight potential entry and exit points in major market indices and ETFs. The curve's design allows investors to see broader market trends more clearly
When to explore it
The Coppock Curve works best for long-term investors and swing traders analyzing major market indices and ETFs. It is most effective in stable, trending markets with clear directional movements. Traders should use it alongside other technical and fundamental analysis tools.
The indicator is particularly useful for identifying potential market bottoms and long-term bullish transitions. It performs well in markets with sustained trends rather than choppy, volatile environments. Investors should apply it to monthly or weekly charts for most reliable signals
Keep exploring
What we’ve verified
Access, alerts and repainting behaviour have not been independently verified for this indicator. Check the creator’s current publication and settings.
General descriptions and classifications are recovered research. Verified details above identify the specific checks we have completed. Check the creator’s current publication for later changes.