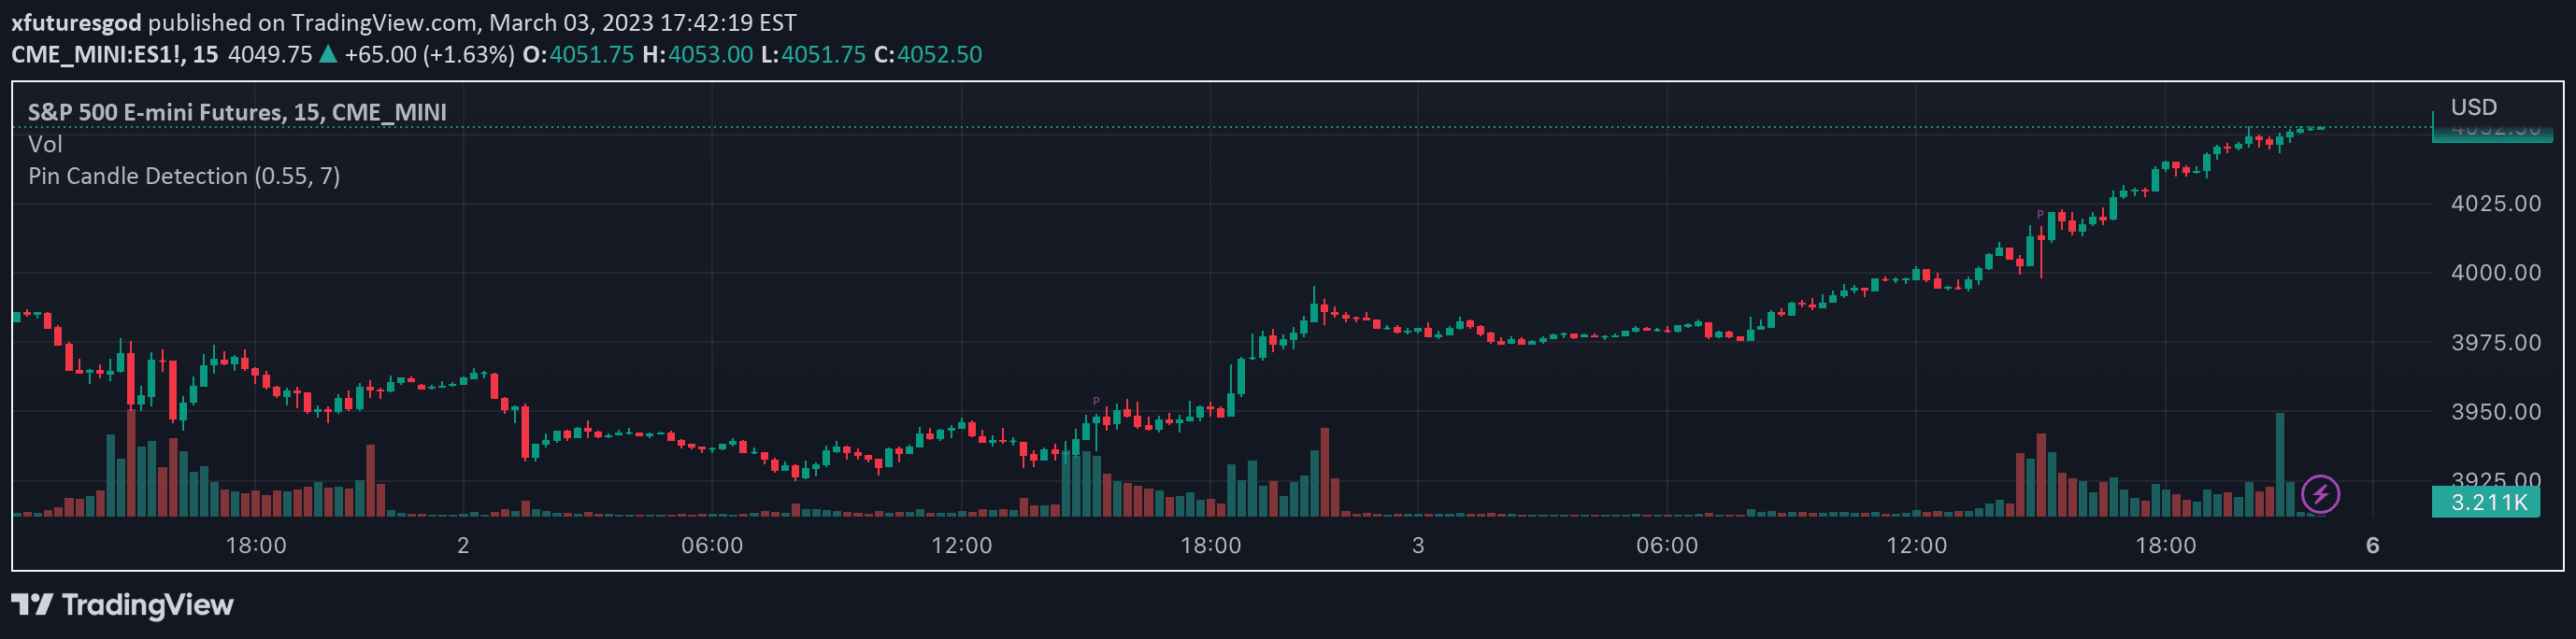
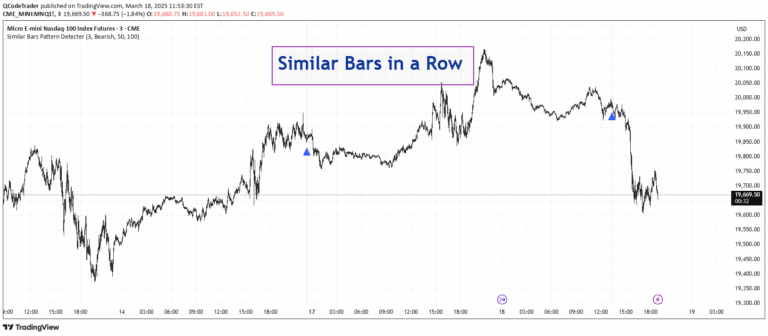
A trading indicator that identifies correction candles using the 3-1-3 pattern, highlighting potential trend reversals with customizable visual markers and comprehensive occurrence tracking.
Explore complementary indicator rolesHow it works
The 3-1-3 correction pattern is a specific price action sequence that signals potential trend interruptions or reversals. It involves analyzing a sequence of candles where three consecutive candles move in one direction, followed by a single consolidation candle, and then three candles moving in a potentially opposite direction.
The indicator automatically scans price charts to detect this precise pattern, marking identified instances with customizable color highlights and directional arrow markers. By systematically tracking these occurrences across different time ranges, traders can quickly visualize potential trend transition points and assess pattern frequency.
Why it may be useful
Identifying correction patterns provides traders with early insights into potential trend changes, allowing for more strategic entry and exit decisions. These patterns help traders recognize moments of market indecision and potential trend reversal, which can be crucial for managing risk and capturing emerging opportunities.
By offering flexible tracking across different time frames and providing visual markers, the indicator transforms complex price action analysis into an intuitive, easily digestible format. This approach enables traders to quickly assess market dynamics and make more informed trading decisions based on recognizable pattern sequences.
When to explore it
The 3-1-3 correction pattern indicator works best in markets with clear directional movements and moderate volatility. It is particularly effective in identifying potential trend transitions in stocks, forex, and cryptocurrency markets where price action tends to exhibit more predictable cyclical behaviors.
Traders should use this indicator in conjunction with other technical analysis tools to confirm signals and reduce false positives. It is especially valuable for traders seeking to capture trend reversals early and manage positions with greater precision across different trading timeframes.
Keep exploring
What we’ve verified
Access, alerts and repainting behaviour have not been independently verified for this indicator. Check the creator’s current publication and settings.
General descriptions and classifications are recovered research. Verified details above identify the specific checks we have completed. Check the creator’s current publication for later changes.