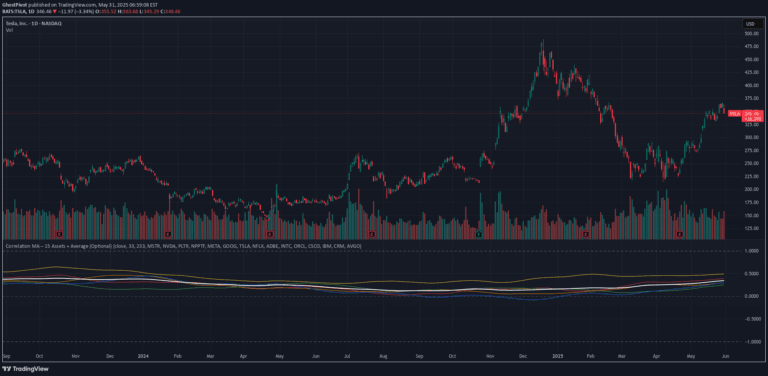
An RSI-based trading signal that detects correlated market movements and generates potential trading indicators across different timeframes and securities.
Explore complementary indicator rolesHow it works
The signal tracks Relative Strength Index (RSI) to identify potential market movement correlations by analyzing price dynamics and momentum. It generates indicators based on the proximity and relationship between current market ticks and historical price patterns.
The algorithm examines multiple timeframes and price data granularity to detect potential trading opportunities, ranging from short-term to long-term perspectives. By assessing volatility and recent price indicators, the signal provides insights into potential market direction and strength.
Why it may be useful
This trading signal offers traders a versatile tool for understanding market momentum and potential price movements across different securities and timeframes. It helps traders identify potential entry and exit points by providing a nuanced view of market dynamics beyond traditional single-indicator approaches.
The signal's flexibility allows traders to adapt to various market conditions, making it valuable for both short-term and long-term trading strategies. By combining RSI analysis with contextual market information, traders can make more informed decisions and potentially improve their trading precision.
When to explore it
The signal works best when used in conjunction with other technical indicators and comprehensive market analysis. It is particularly effective for traders seeking a dynamic, multi-timeframe approach to market evaluation that can adapt to different securities and trading styles.
Ideal usage includes day trading, short-term momentum plays, and identifying potential trend reversals. Traders should combine this signal with additional confirmation indicators like Heiken Ashi and maintain a cautious, risk-managed approach to trading.
Keep exploring
What we’ve verified
Access, alerts and repainting behaviour have not been independently verified for this indicator. Check the creator’s current publication and settings.
General descriptions and classifications are recovered research. Verified details above identify the specific checks we have completed. Check the creator’s current publication for later changes.