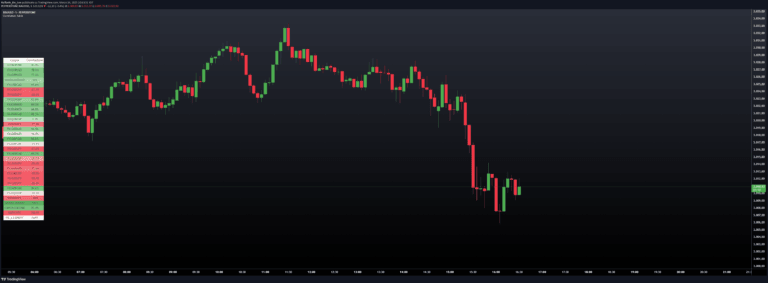
A custom script for analyzing correlations between financial instruments using advanced array manipulation techniques and statistical methods to assess relationships and potential trading opportunities.
Explore complementary indicator rolesHow it works
The script systematically loops through arrays to calculate correlations between different financial instruments using advanced statistical methods. It leverages array covariance and standard deviation calculations to determine the strength and direction of relationships.
By processing multiple symbols simultaneously, the script creates a comprehensive correlation matrix that reveals how different assets interact. The approach overcomes limitations of traditional Pine correlation functions by using custom calculation methods. Each symbol is analyzed using a specified look-back period, enabling traders to understand complex market dynamics
Why it may be useful
Correlation analysis is crucial for understanding market interconnectedness and managing portfolio risk. By revealing how different financial instruments move in relation to each other, traders can make more informed decisions about asset allocation and potential hedging strategies.
The script provides a sophisticated tool for identifying hidden market relationships that might not be immediately apparent. Understanding correlations helps traders diversify their portfolios, reduce systemic risk, and potentially anticipate market movements based on related asset behaviors
When to explore it
This correlation script is most effective during complex market conditions with multiple interconnected assets. It works best for traders managing diversified portfolios across different sectors or asset classes. Ideal scenarios include analyzing relationships between stocks, commodities, currencies, and indices.
Traders can use this tool during periods of market uncertainty to understand potential spillover effects and correlative trends. It's particularly useful for developing robust trading strategies that account for broader market dynamics and potential cross-asset influences
Keep exploring
What we’ve verified
Access, alerts and repainting behaviour have not been independently verified for this indicator. Check the creator’s current publication and settings.
General descriptions and classifications are recovered research. Verified details above identify the specific checks we have completed. Check the creator’s current publication for later changes.