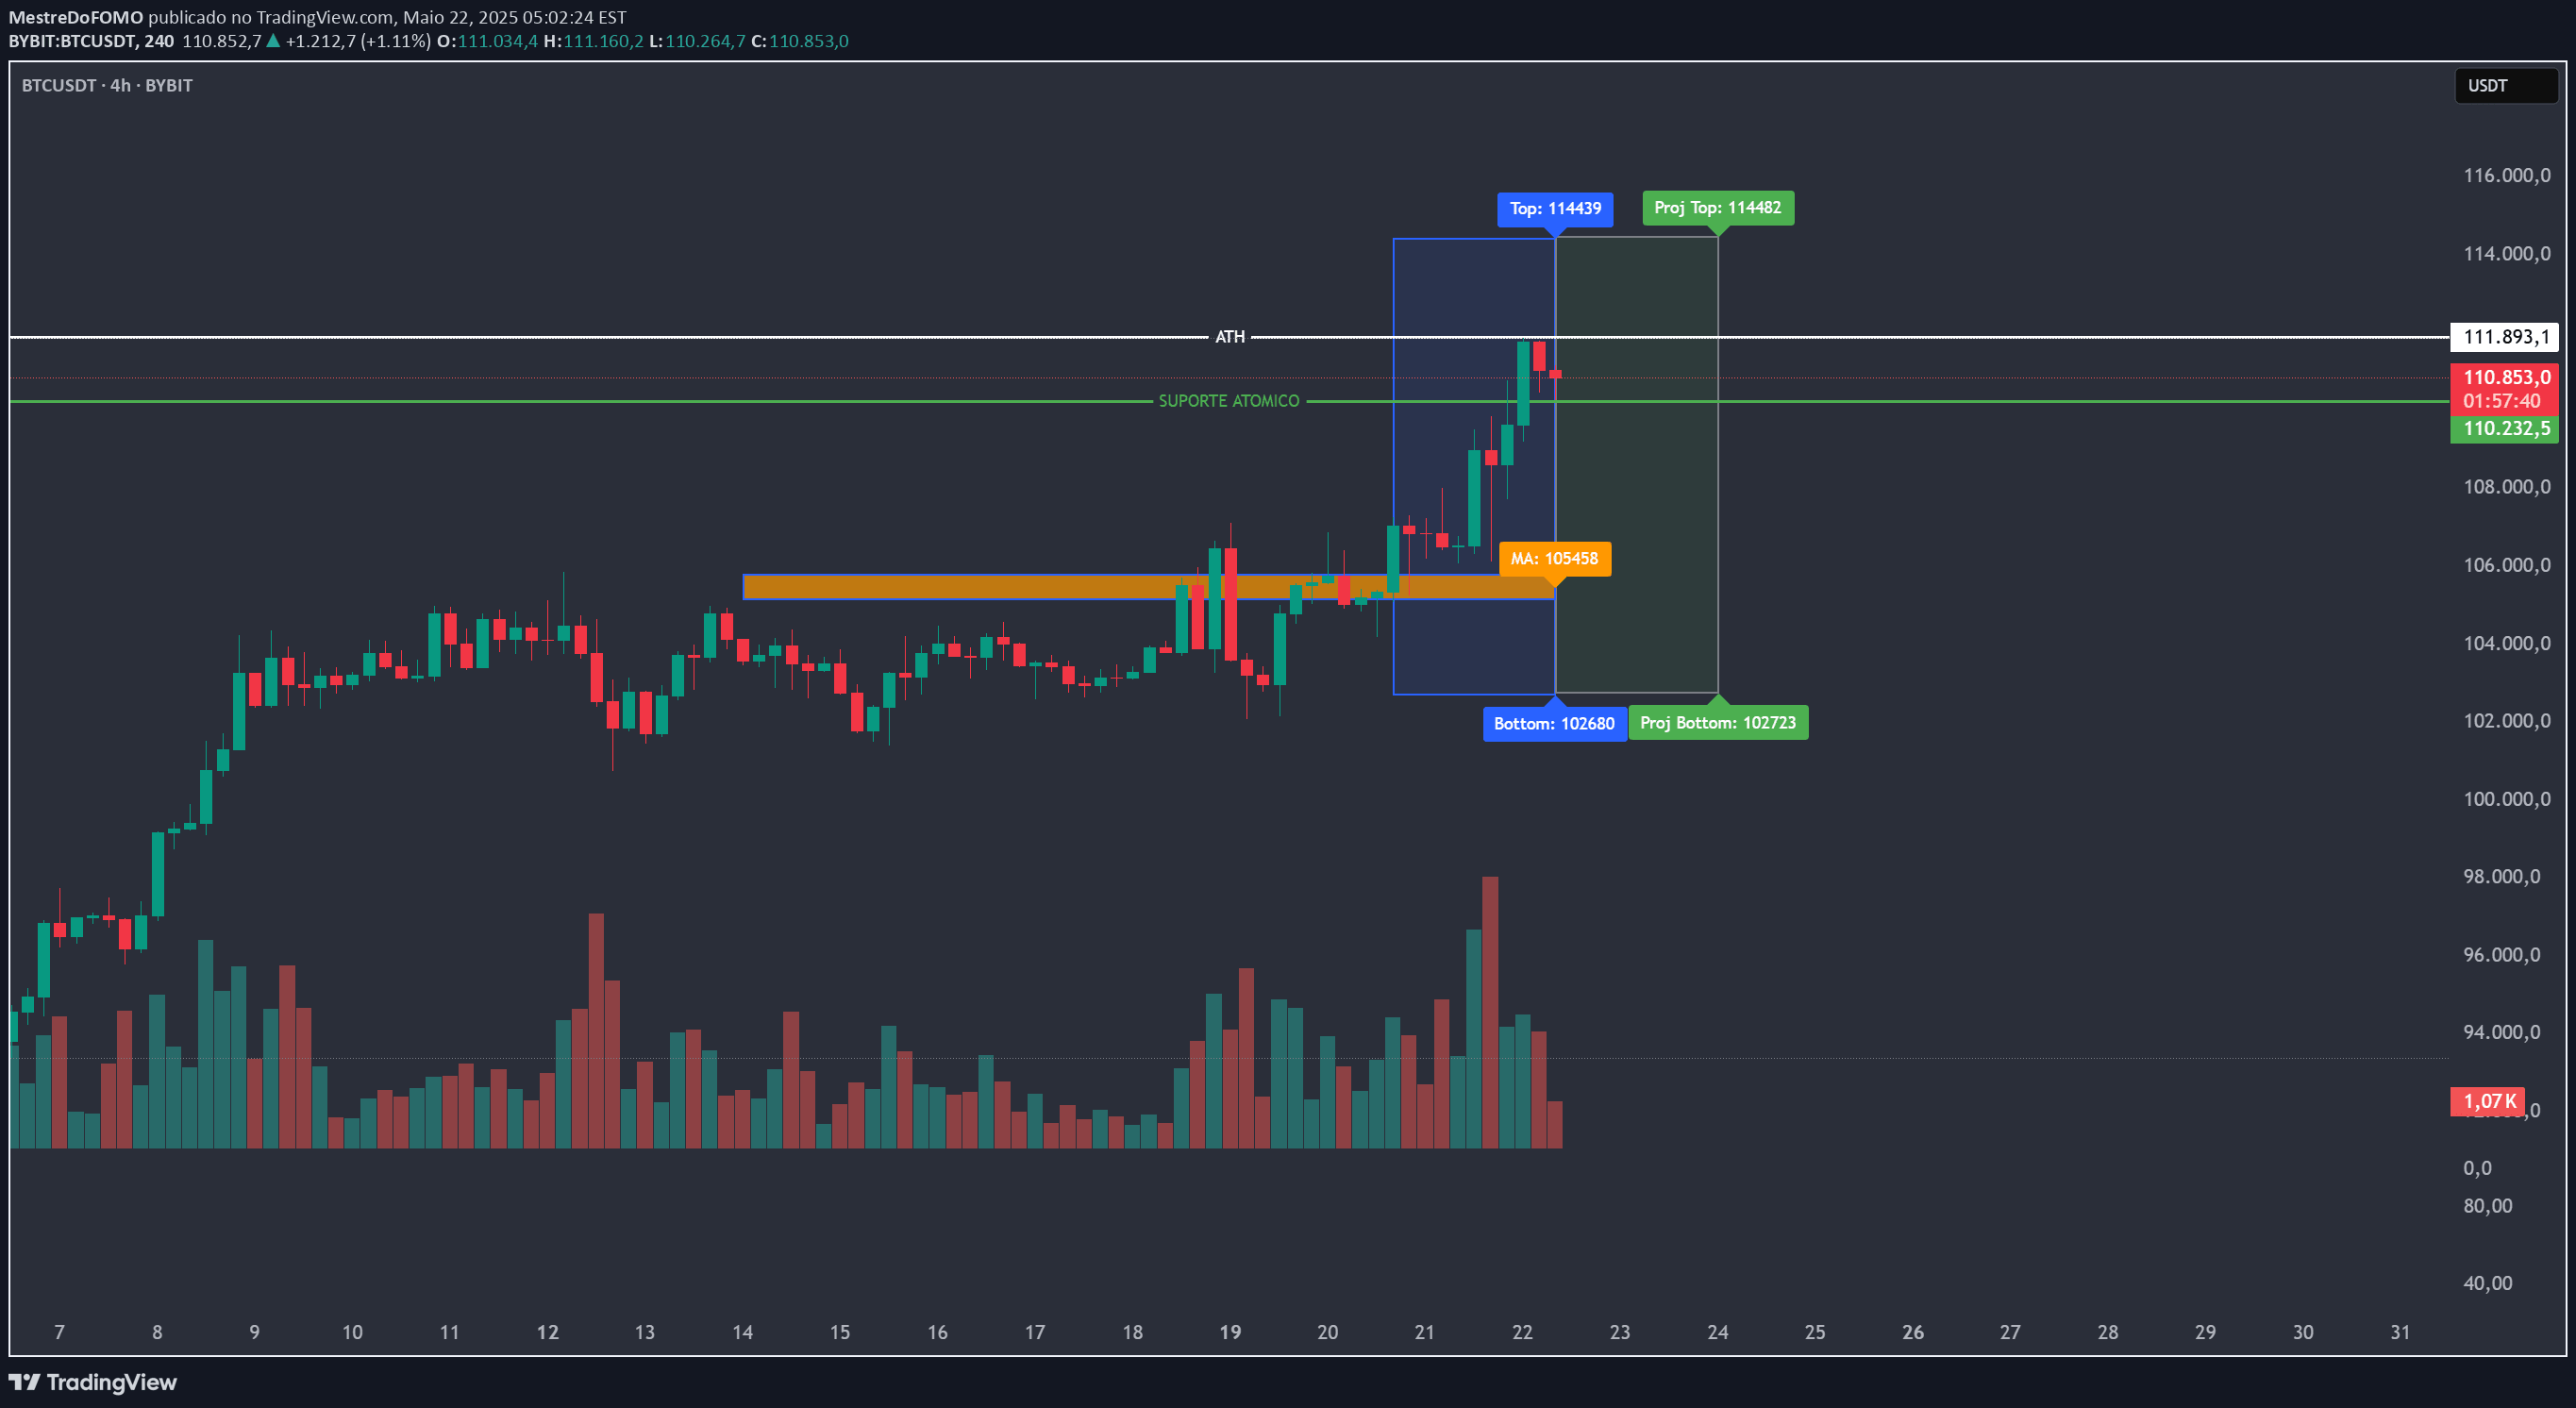
A crypto market cycle projection indicator that visually tracks repeating price cycles by highlighting start, midpoint, and end zones to help traders understand market timing and potential pivot periods.
Explore complementary indicator rolesHow it works
The Crypto Cycle Projection indicator works by establishing a defined time-based cycle that tracks price movements across a specified period. Traders can choose to start the cycle from the most recent candle or manually set a specific start date, providing flexibility in analysis.
The indicator divides the cycle into three key zones: Start (white), Midpoint (yellow), and End (green), each representing different stages of market movement. By setting a cycle period, traders can visualize how price potentially moves through these zones, offering insights into potential market transitions and timing.
Why it may be useful
This indicator provides traders with a structured approach to understanding market cycles, which can be crucial in making more informed trading decisions. By visualizing potential cycle movements, traders can better anticipate market transitions and prepare strategies accordingly.
The color-coded zones help traders quickly identify different stages of market movement, potentially highlighting opportunities for reversals, continuations, or volatility expansions. This systematic approach reduces emotional decision-making and provides a more objective framework for analyzing market dynamics.
When to explore it
The Crypto Cycle Projection indicator is most effective in markets with recurring patterns and identifiable cycles, such as cryptocurrency trading. It works best when markets exhibit some level of predictability and when traders are looking to understand broader market rhythms beyond short-term price fluctuations.
Traders should use this indicator in conjunction with other technical analysis tools to confirm signals and validate potential market movements. It is particularly useful for swing traders and day traders who are interested in understanding longer-term market structures and timing potential entry and exit points.
Keep exploring
What we’ve verified
Access, alerts and repainting behaviour have not been independently verified for this indicator. Check the creator’s current publication and settings.
General descriptions and classifications are recovered research. Verified details above identify the specific checks we have completed. Check the creator’s current publication for later changes.