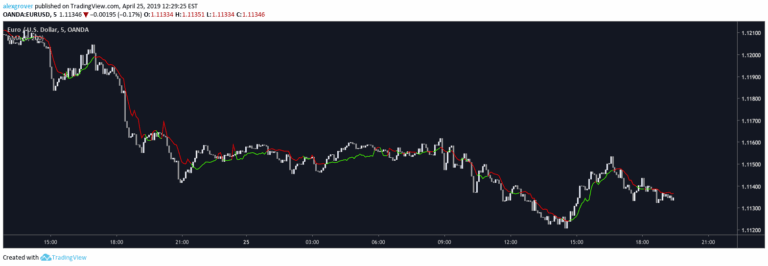
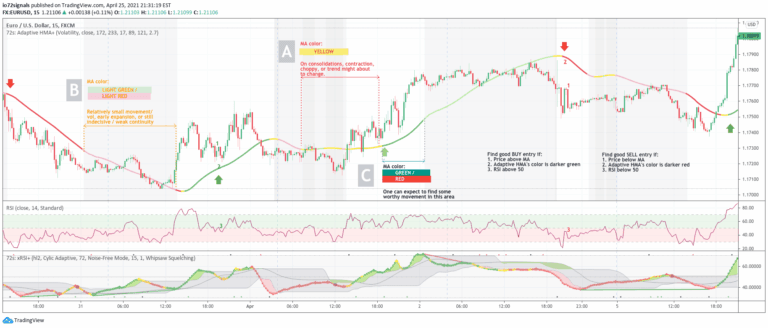
A comprehensive trading chart package featuring multiple integrated indicators designed to provide traders with a multi-dimensional view of market dynamics and potential trend signals.
Explore complementary indicator rolesHow it works
This All-in-One-Chart indicator combines multiple technical analysis tools to provide a comprehensive market view. It integrates price action bars, double Bollinger Bands, Ichimoku Cloud, Triple Exponential Moving Average with VWMA, Parabolic SAR, Fractal Support Resistance, and Price Channel indicators.
Each component analyzes different aspects of market behavior, such as trend direction, momentum, volatility, and potential support/resistance levels. By layering these indicators, traders can cross-reference multiple signals to confirm trading decisions and reduce false signal risks
Why it may be useful
Comprehensive indicator packages like this provide traders with a holistic market analysis approach. By combining multiple technical indicators, traders can gain deeper insights into market dynamics that single indicators might miss. These integrated tools help reduce subjective interpretation and provide more objective trading signals.
They enable traders to confirm trends, identify potential entry and exit points, and manage risk more effectively. The multi-indicator approach increases confidence in trading decisions by providing multiple perspectives on market behavior
When to explore it
This indicator package is most effective in markets with clear trend characteristics, such as cryptocurrency, forex, and major stock indices. It works best during periods of moderate to high market volatility where multiple technical signals can provide more reliable insights.
Traders should use this during trending markets rather than highly choppy or range-bound conditions. It is particularly useful for swing and day traders who require multiple confirmation signals before making trading decisions
Keep exploring
What we’ve verified
Access, alerts and repainting behaviour have not been independently verified for this indicator. Check the creator’s current publication and settings.
General descriptions and classifications are recovered research. Verified details above identify the specific checks we have completed. Check the creator’s current publication for later changes.