
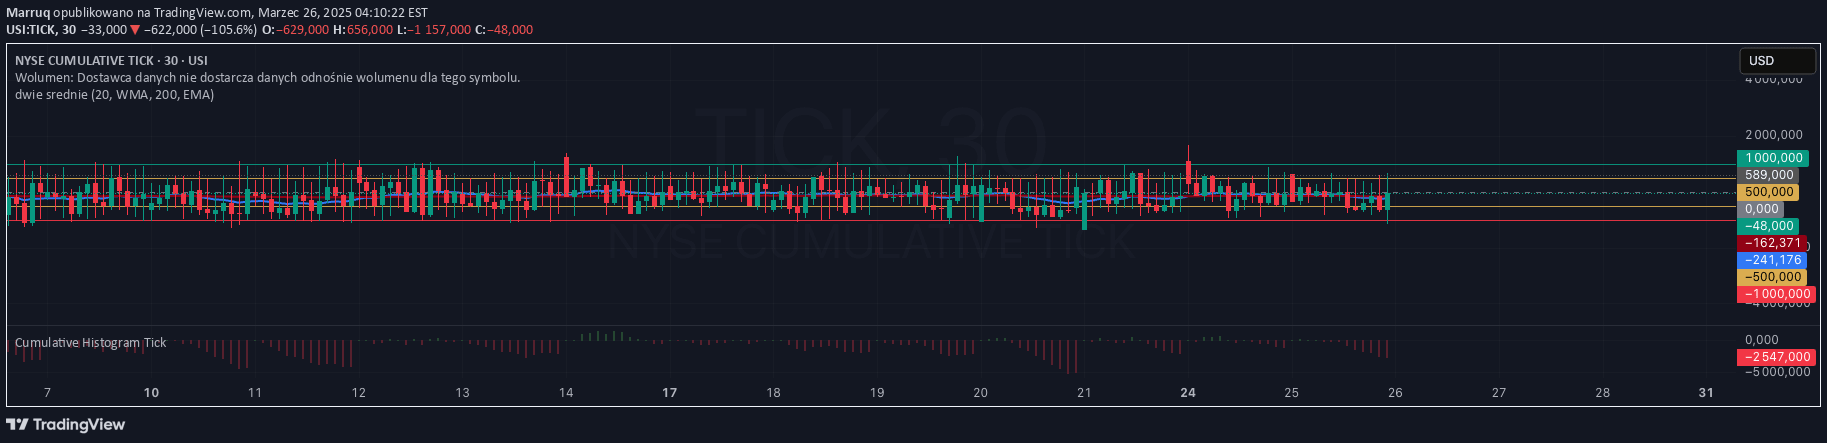
A cumulative histogram tracking tick data during a trading session, helping traders analyze intraday market activity and identify trends through real-time tick accumulation.
Explore complementary indicator rolesHow it works
The script retrieves tick data for a specific financial instrument using request.security function. It initializes a cumulative value that starts at zero at the beginning of each trading session (9:30 AM). As the session progresses, each tick value is added to the cumulative total, creating a running sum.
The script prevents further accumulation after the session ends (4:00 PM). The cumulative value is then plotted as a histogram, with color changes indicating positive or negative accumulation throughout the trading day
Why it may be useful
This indicator provides traders with a dynamic visualization of market momentum and sentiment during a trading session. By tracking the cumulative tick values, traders can gain insights into the overall market direction and strength.
The histogram helps identify bullish or bearish trends quickly, offering a real-time snapshot of market movement. It can reveal potential trend reversals, market sentiment shifts, and provide a comprehensive view of intraday trading dynamics that might not be apparent from individual price movements
When to explore it
The tick data cumulative histogram is most effective during active trading sessions with significant market volatility. It works best for day traders who want to monitor intraday market sentiment and momentum.
Traders can use this indicator during key market hours, especially around market open and during periods of high trading activity. It is particularly useful for stocks, futures, and other instruments with consistent trading volumes. The indicator helps traders make quick decisions by providing a rapid overview of market trends
Keep exploring
What we’ve verified
Access, alerts and repainting behaviour have not been independently verified for this indicator. Check the creator’s current publication and settings.
General descriptions and classifications are recovered research. Verified details above identify the specific checks we have completed. Check the creator’s current publication for later changes.


