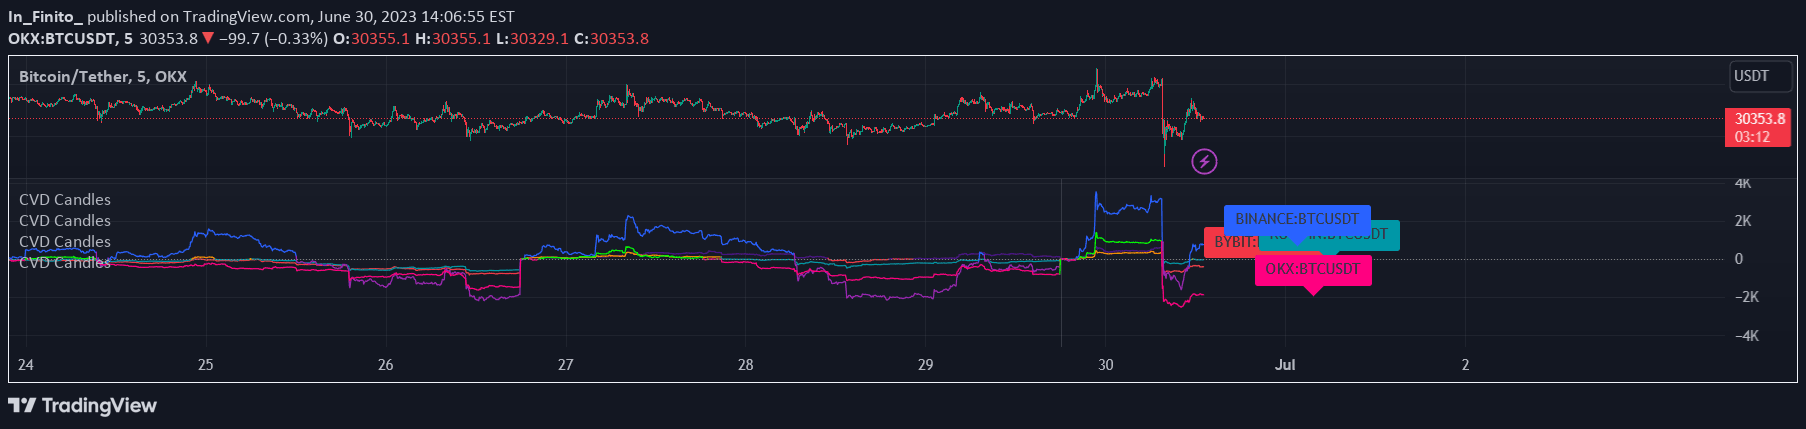
A cumulative indicator tracking volume and candle characteristics through three separate plots that continuously accumulate values over trading time periods.
Explore complementary indicator rolesHow it works
The Cumulative Volume Price indicator generates three distinct cumulative plots by continuously adding specific values from zero across trading sessions. The first plot tracks cumulative volume, progressively summing total trading volume over time. The second and third plots measure cumulative candle body width and cumulative high-low range width respectively, providing a dynamic representation of price movement characteristics.
Each plot represents a running total that grows incrementally, allowing traders to observe the progressive accumulation of trading activity and price range expansions. These cumulative measurements offer a unique perspective on market dynamics by transforming discrete trading data into continuous, expanding metrics.
Why it may be useful
Cumulative plots provide traders with a comprehensive view of market activity that goes beyond traditional single-period analysis. By tracking continuous accumulation, these plots reveal underlying trading volume and price movement trends that might be obscured in standard chart representations. The indicator helps traders understand the sustained momentum and energy behind price movements.
The ability to visualize cumulative data allows for more nuanced market interpretation, helping traders identify potential trend strength, momentum shifts, and sustained trading interest. These insights can be particularly valuable in determining whether observed price movements are supported by consistent trading volume and sustained market participation.
When to explore it
The Cumulative Volume Price indicator is most effective during periods of clear market trends and consistent trading activity. It performs well in markets with steady volume and predictable price movements, making it particularly useful in liquid markets like major forex pairs, large-cap stocks, and prominent cryptocurrency pairs.
Traders should consider using this indicator during stable market conditions with regular trading patterns. The indicator is less reliable during highly volatile or choppy market periods where trading volume and price ranges fluctuate dramatically. Optimal usage occurs when seeking to confirm trend strength, assess sustained market interest, and gain insights into the underlying momentum of price movements across different timeframes.
Keep exploring
What we’ve verified
Access, alerts and repainting behaviour have not been independently verified for this indicator. Check the creator’s current publication and settings.
General descriptions and classifications are recovered research. Verified details above identify the specific checks we have completed. Check the creator’s current publication for later changes.