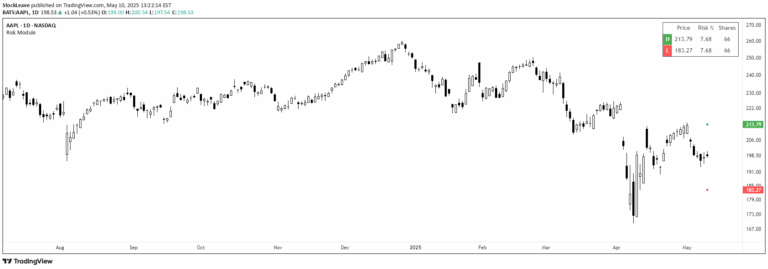
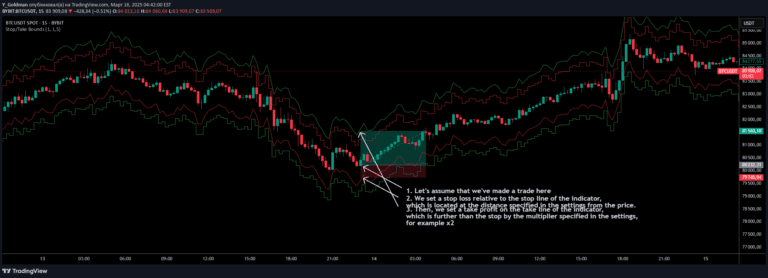
A dynamic trade management tool using Average True Range to visualize and manage trade entry, stop loss, and take profit levels with unique curved visualizations.
Explore complementary indicator rolesHow it works
The Curved Management indicator leverages the Average True Range (ATR) to dynamically calculate stop-loss and take-profit levels based on current market volatility. It allows traders to set entry points by clicking directly on the chart, with the tool automatically generating curved or straight-edged visualization lines representing risk management parameters.
By using the ATR as a core calculation method, the indicator adapts to changing market conditions, providing a flexible approach to position management. Traders can customize the risk and reward multipliers to fine-tune their trade setup, making it a versatile tool for different trading styles and market environments.
Why it may be useful
The Curved Management indicator provides traders with a visual and intuitive approach to risk management, transforming complex trading decisions into easily understandable graphical representations. By integrating volatility measurements and customizable parameters, it helps traders make more informed decisions about potential trade entries and exits.
The unique curved visualization sets this tool apart from traditional straight-line indicators, offering a more aesthetically pleasing and potentially more engaging way to view trade management parameters. Its adaptability to different market conditions and trading styles makes it a valuable tool for traders seeking a more dynamic and personalized approach to trade management.
When to explore it
The Curved Management indicator is most effective in markets with clear trends and consistent volatility, where ATR-based calculations can provide meaningful insights into potential trade setups. It works particularly well for traders who prefer a data-driven approach to risk management and want a visual representation of their trading strategy.
Traders should consider using this tool in markets like forex, stocks, and cryptocurrencies, where volatility can change rapidly. It is especially useful for traders who want to quickly assess potential risk-reward scenarios and make informed decisions about trade entries and exits across different timeframes and market conditions.
Keep exploring
What we’ve verified
Access, alerts and repainting behaviour have not been independently verified for this indicator. Check the creator’s current publication and settings.
General descriptions and classifications are recovered research. Verified details above identify the specific checks we have completed. Check the creator’s current publication for later changes.