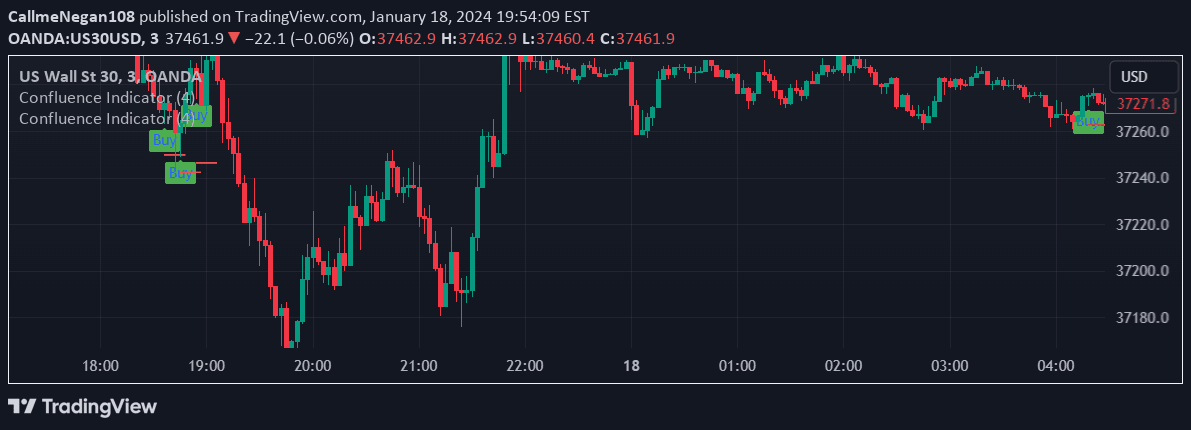
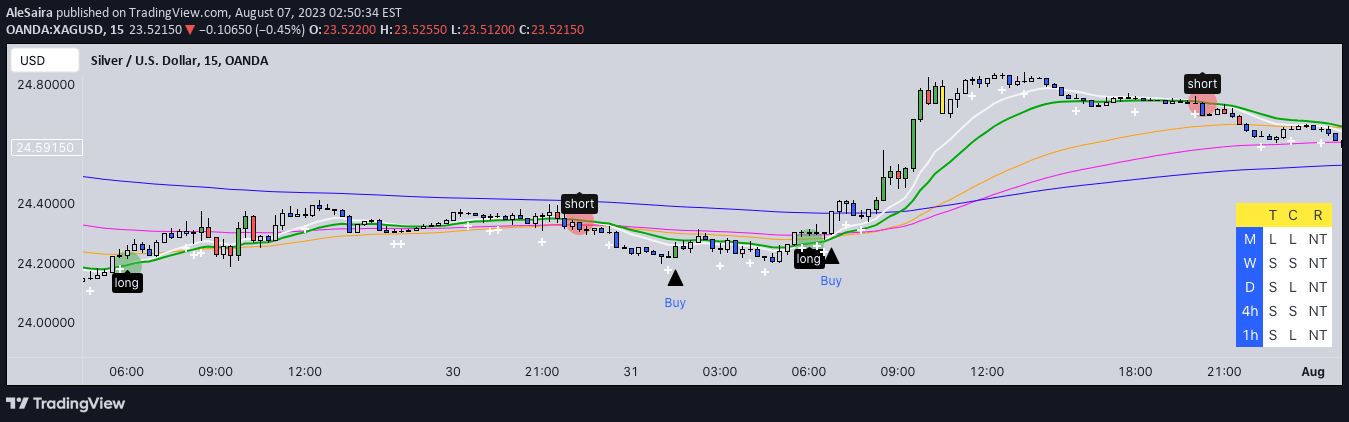
A trading signal based on comparing current price to EMA 9, identifying significant price movements and trend changes through color-coded candles and EMA crossover markers.
Explore complementary indicator rolesHow it works
The signal operates by first comparing the current close price with the 9-period Exponential Moving Average (EMA), determining whether the price is above or below this key level. It simultaneously evaluates the current candle body's size relative to the previous candle, identifying significant price movements that might indicate potential trend shifts.
When the current candle body is considered large, the signal changes the candle color to reflect its position relative to EMA 9 - red if below and green if above. Additionally, the signal plots triangular markers to highlight EMA crossovers, with blue triangles indicating crossovers above and red triangles showing crossovers below, providing visual cues about potential trend changes.
Why it may be useful
This signal helps traders quickly identify potential trend reversals and significant price movements by providing clear visual indicators of market dynamics. By using the 9-period EMA as a reference point, traders can rapidly assess whether the current price action suggests bullish or bearish momentum.
The color-coded candles and triangular markers offer an intuitive way to understand market structure, allowing traders to make faster, more informed decisions. The combination of EMA positioning, candle size evaluation, and crossover markers provides a comprehensive view of short-term price behavior.
When to explore it
The signal is most effective in markets with clear, directional movements and during periods of increased volatility where significant price changes are more likely to occur. It works particularly well in shorter timeframes such as scalping and day trading, where rapid identification of potential trend shifts is crucial.
Traders should use this signal in conjunction with other technical indicators to confirm potential trade entries and exits. It is especially useful in liquid markets with high trading volume, where price movements are more likely to follow through and provide meaningful trading opportunities.
Keep exploring
What we’ve verified
Access, alerts and repainting behaviour have not been independently verified for this indicator. Check the creator’s current publication and settings.
General descriptions and classifications are recovered research. Verified details above identify the specific checks we have completed. Check the creator’s current publication for later changes.