
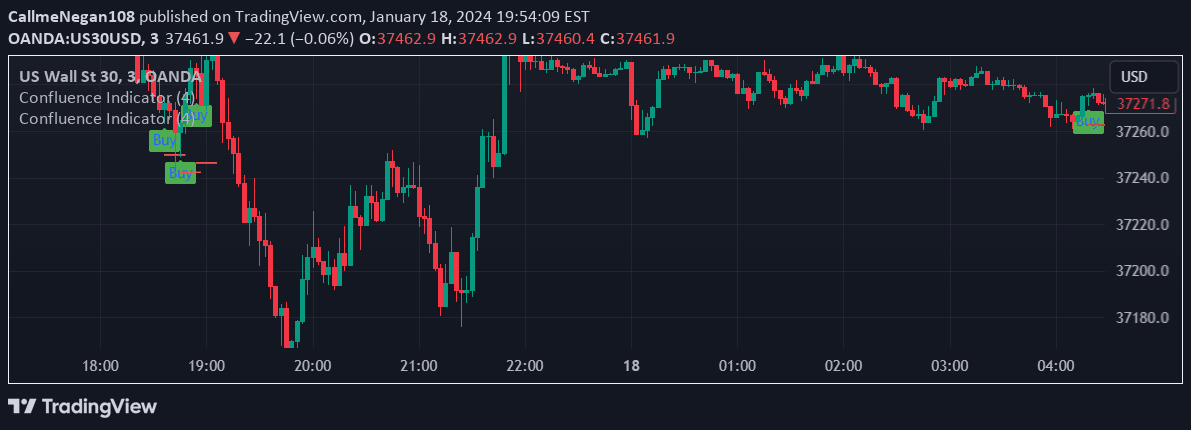
A comprehensive trading indicator combining multiple technical analysis strategies like MACD, RSI, and Fibonacci to generate confluence-based buy and sell signals with customizable strategy alignment.
Explore complementary indicator rolesHow it works
The Confluence Indicator with Fibonacci operates by integrating multiple technical analysis strategies to generate trading signals. It uses a systematic approach that allows traders to select and enable specific strategies like MACD, RSI, Bollinger Bands, Divergence, Fibonacci, and Moving Average crossovers.
The indicator calculates signals based on user-defined confluence criteria, requiring a minimum number of strategies to align before triggering a buy or sell signal. It also incorporates additional features like support and resistance levels, pivot points, and automatic stop-loss calculations to enhance trading decision-making.
Why it may be useful
This indicator provides traders with a comprehensive, multi-strategy approach to market analysis, reducing the risk of false signals by requiring multiple technical indicators to confirm a trading opportunity. By combining different strategies, it offers a more robust and nuanced view of market conditions compared to single-indicator approaches.
The customizable nature of the indicator allows traders to adapt their analysis to different market conditions, trading styles, and personal risk preferences. Its ability to integrate various technical analysis methods makes it a powerful tool for traders seeking a more holistic and flexible trading strategy.
When to explore it
The Confluence Indicator with Fibonacci is most effective in markets with clear trends and significant technical structure, such as forex, stocks, and cryptocurrency markets. It works best when multiple technical indicators can provide complementary signals, helping traders identify high-probability trading opportunities.
Traders should use this indicator in conjunction with other forms of analysis, such as fundamental research and market sentiment. It is particularly useful during periods of market volatility, where multiple technical signals can help confirm potential entry and exit points more reliably.
Keep exploring
What we’ve verified
Access, alerts and repainting behaviour have not been independently verified for this indicator. Check the creator’s current publication and settings.
General descriptions and classifications are recovered research. Verified details above identify the specific checks we have completed. Check the creator’s current publication for later changes.


