ICT Friday's Asian Range°
An ICT trading technique focusing on liquidity draw potential for the next trading week by analyzing Friday's Asian Range on 5 and 15-minute charts.
Explore 11,183 indicators. Filter beyond the obvious.
Discover the tools that fit the way you trade.
11,183 tools to explore
An ICT trading technique focusing on liquidity draw potential for the next trading week by analyzing Friday's Asian Range on 5 and 15-minute charts.
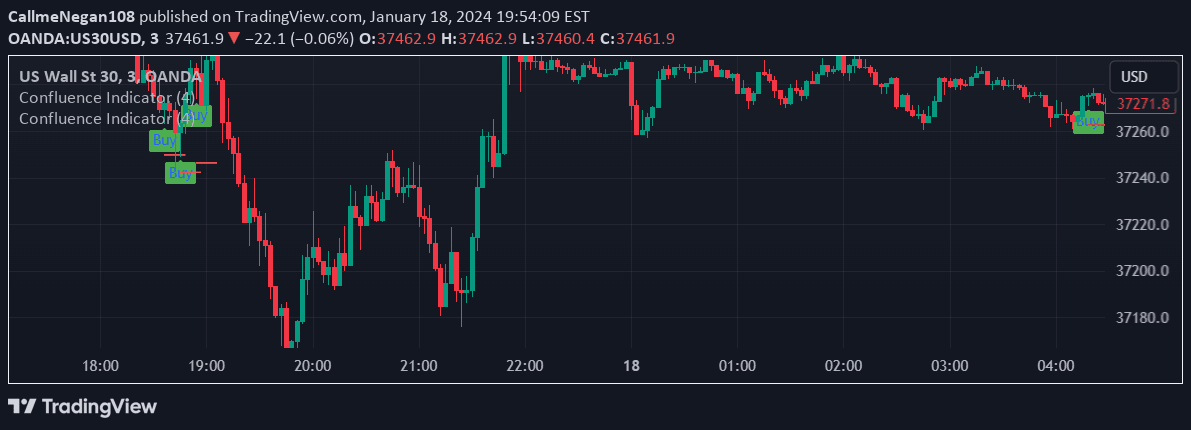
A comprehensive trading indicator combining multiple technical analysis strategies like MACD, RSI, and Fibonacci to generate confluence-based buy and sell signals with customizable strategy alignment.
A cycle projection tool that identifies potential future market turning points by plotting vertical lines based on historical swing highs and lows to discover potential cycle confluences.
A precision trading indicator that identifies institutional order blocks using price action and volume analysis, helping traders detect high-probability trading zones where smart money likely places orders.
A comprehensive market analysis tool combining Fair Value Gaps, Order Blocks, RSI Divergence, and Volume Spikes to identify high-probability trading opportunities with multiple confluence factors.
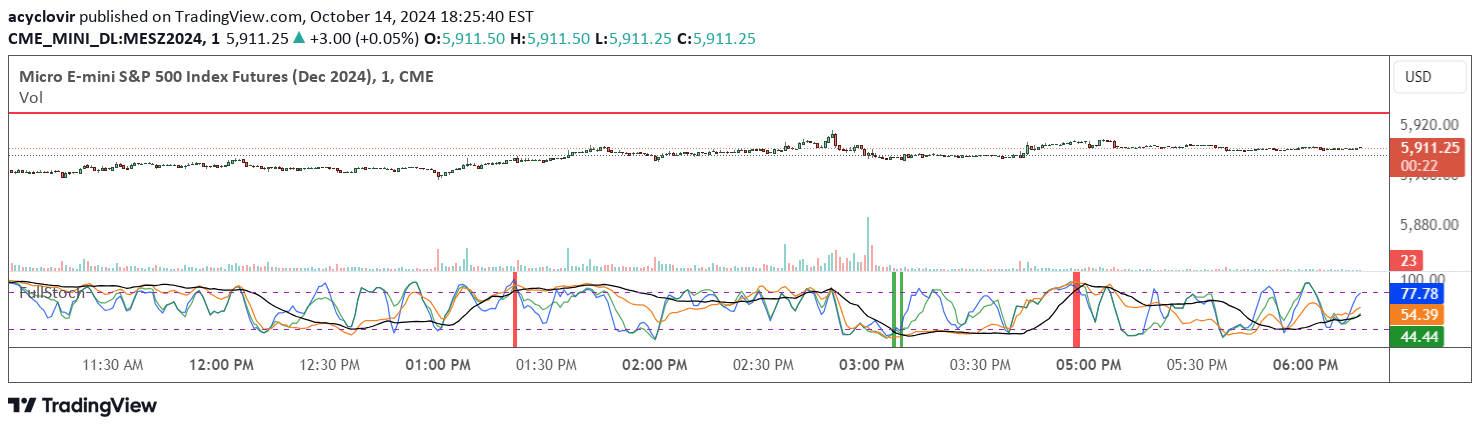
A multi-timeframe Stochastic indicator that identifies potential buy and sell signals by analyzing overbought and oversold conditions across four different lookback periods.
A trading tool from Vexly that generates gamma, vanna, and charm levels using option greeks heatmaps to identify key trading confluences and range levels.
A multi-timeframe confluence panel that combines trend, momentum, sweep, structure, and trap signals to provide comprehensive market analysis and directional bias.
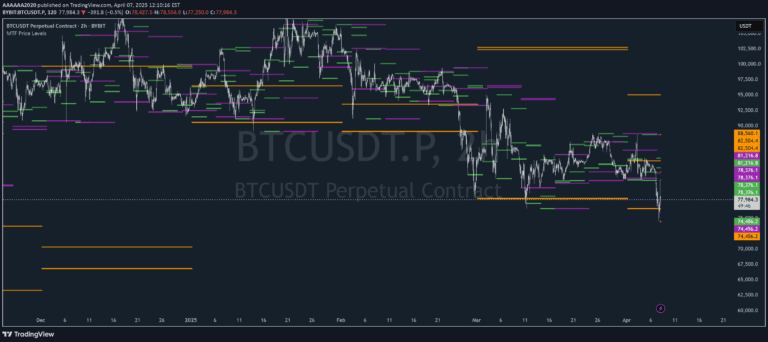
A multi-timeframe price level indicator that reveals key support and resistance zones across different chart timeframes, helping traders identify significant price regions for strategic trading decisions.
A sophisticated trading strategy combining Anchored VWAP, Fibonacci Retracement, and Candlestick Patterns to identify high-quality trade entries with precise confluences and risk management.
An overnight futures trading signal strategy focusing on E-mini S&P 500 using technical confluences like candle body analysis, fractals, RSI, and ATR to identify high-probability trade entries.
A multi-timeframe EMA indicator that overlays 1-hour, 4-hour, and daily exponential moving averages to provide comprehensive price momentum and trend analysis across different trading intervals.
Likes, views, and comments are historical TradingView snapshots. They describe attention, not trading performance.