
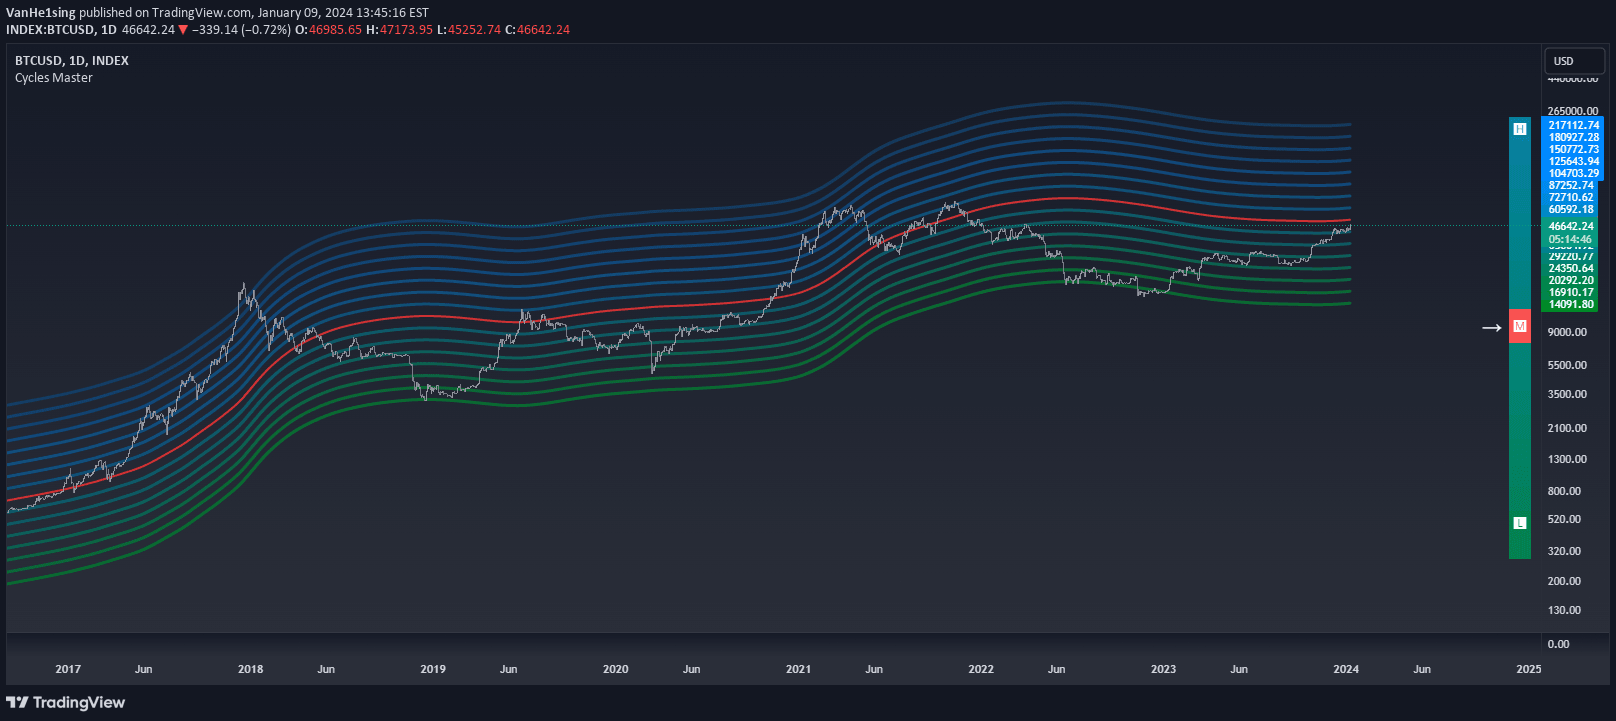
The Cycles Master Indicator reveals cyclical patterns in market trends by aligning cycle lines with price peaks and determining cycle frequencies through adjustable parameters.
Explore complementary indicator rolesHow it works
The Cycles Master Indicator operates by utilizing two primary parameters: Multiplication and MA Length to analyze market cyclical patterns. The Multiplication parameter allows users to align cycle lines precisely with the upper extremes of price action, enabling a more accurate visualization of market cycles.
The MA Length parameter controls the frequency of displayed cycles, with shorter lengths capturing more frequent short-term market fluctuations and longer lengths revealing smoother, long-term trend patterns. By adjusting these parameters, traders can customize the indicator to match their specific trading timeframe and market analysis requirements.
Why it may be useful
The Cycles Master Indicator provides traders with a sophisticated tool for understanding underlying market rhythms and potential trend reversals. By visualizing cyclical patterns, traders can gain insights into market momentum and potential directional shifts that might not be immediately apparent through traditional price analysis.
The indicator's flexibility in adjusting cycle lines and frequencies makes it a valuable asset for traders seeking to develop a more nuanced understanding of market behavior. Its gradient vertical box with color-coded cycle lines offers an intuitive visual representation of market cycles, helping traders identify potential entry and exit points more effectively.
When to explore it
The Cycles Master Indicator is most effective when traders want to analyze market trends across different timeframes, from short-term scalping to longer-term swing trading strategies. It performs exceptionally well in markets with clear cyclical patterns, such as forex, commodities, and certain stock indices where repetitive price movements are more pronounced.
Traders should use this indicator in conjunction with other technical analysis tools to confirm signals and reduce false positives. It is particularly useful during periods of market consolidation or when seeking to identify potential trend reversals before they become obvious through traditional price action analysis.
Keep exploring
What we’ve verified
Access, alerts and repainting behaviour have not been independently verified for this indicator. Check the creator’s current publication and settings.
General descriptions and classifications are recovered research. Verified details above identify the specific checks we have completed. Check the creator’s current publication for later changes.





