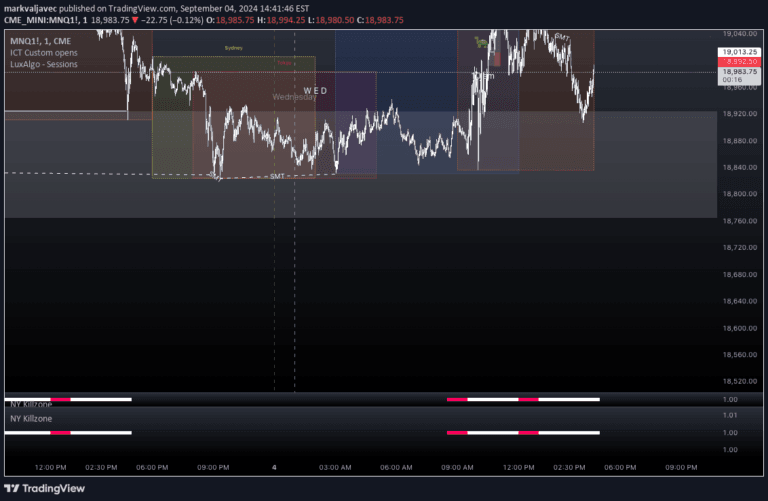
A multi-timeframe break indicator that plots breaks across different time periods, offering traders a comprehensive view of market structure with timezone flexibility.
Explore complementary indicator rolesHow it works
The multi-timeframe break indicator analyzes price action across various timeframes including daily, weekly, monthly, quarterly, half-yearly, and yearly periods. It identifies and plots key break levels where price transitions from one structural zone to another, providing traders with a comprehensive view of market structure and potential turning points.
By offering timezone flexibility, particularly with a New York timezone option, the indicator allows traders to view market breaks in alignment with institutional trading perspectives. This approach helps traders understand market dynamics from different temporal perspectives, enabling more nuanced analysis of price movements and potential trend changes.
Why it may be useful
Multi-timeframe break analysis is crucial for traders seeking a holistic understanding of market structure and potential trend reversals. By examining breaks across different time periods, traders can gain insights into broader market dynamics that might not be visible on a single timeframe, helping to identify more robust trading opportunities.
The timezone flexibility further enhances the indicator's utility by allowing traders to align their analysis with institutional trading perspectives. This approach can provide a more sophisticated view of market movements, potentially revealing hidden patterns and improving trade decision-making across various trading styles and timeframes.
When to explore it
This indicator is most effective when traders want to analyze market structure across multiple timeframes and identify potential trend changes or breakout opportunities. It is particularly useful during periods of market transition, where understanding broader structural dynamics can provide a competitive edge in trading decisions.
Traders should consider using this indicator during key market events, economic releases, or when seeking to understand the overall market context beyond immediate price action. Its multi-timeframe approach makes it valuable for scalpers, day traders, and swing traders looking to make more informed trading decisions.
Keep exploring
What we’ve verified
Access, alerts and repainting behaviour have not been independently verified for this indicator. Check the creator’s current publication and settings.
General descriptions and classifications are recovered research. Verified details above identify the specific checks we have completed. Check the creator’s current publication for later changes.