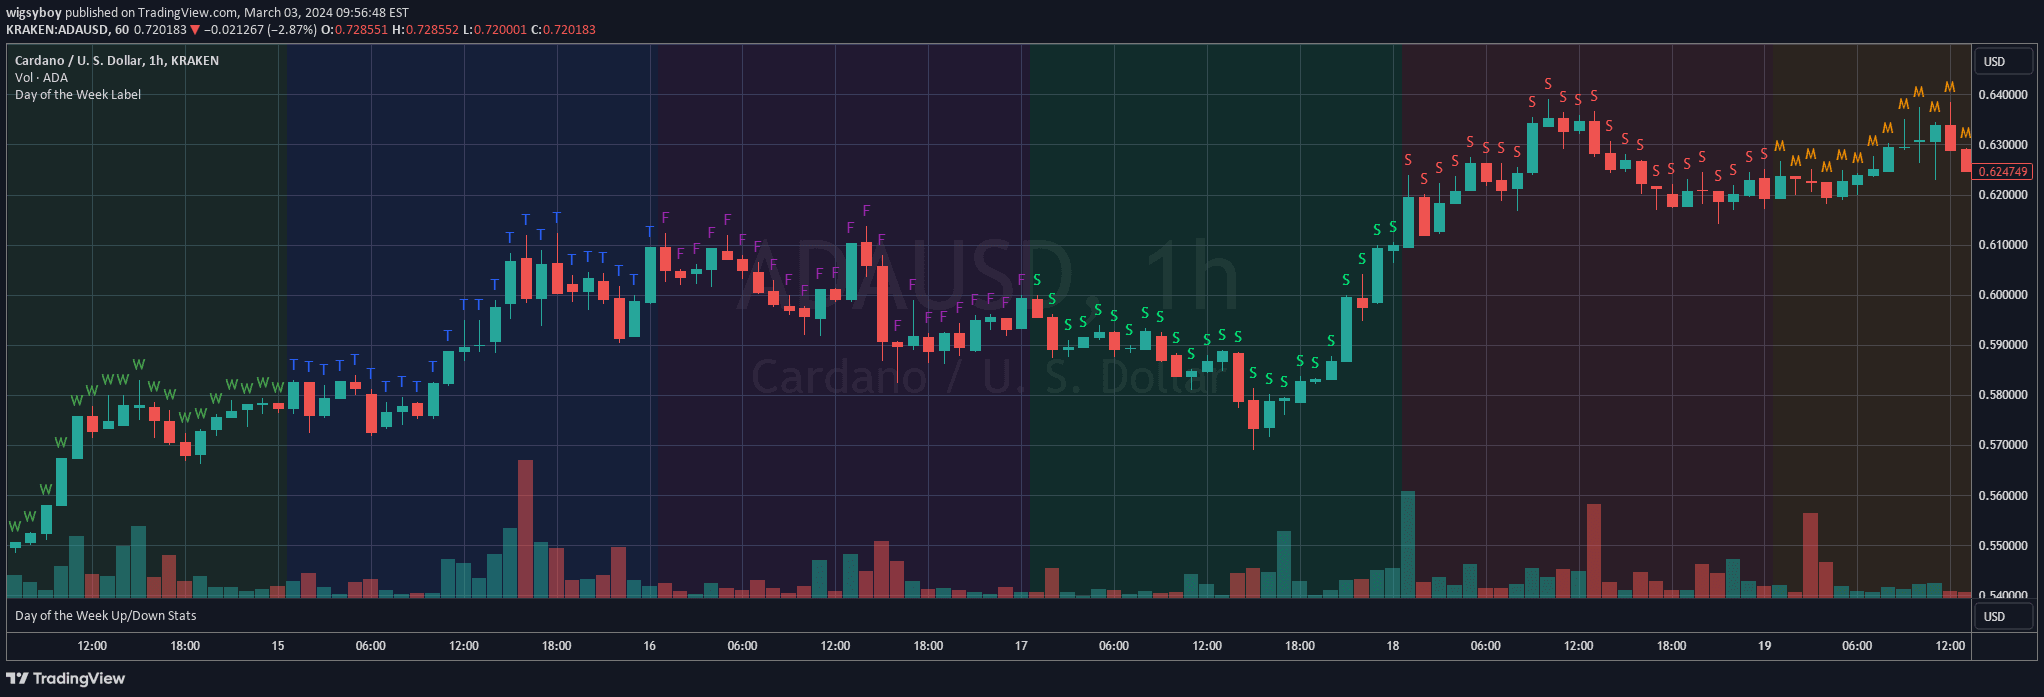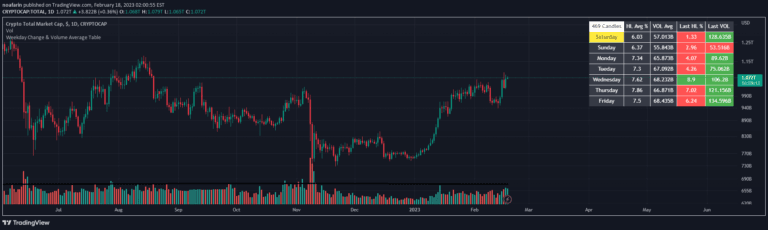
Weekday Change & Volume Average Table
A script analyzing price movement and trading volume patterns across different weekdays, helping traders understand market behavior and potential trading opportunities.
Explore 11,183 indicators. Filter beyond the obvious.
Discover the tools that fit the way you trade.
11,183 tools to explore
A script analyzing price movement and trading volume patterns across different weekdays, helping traders understand market behavior and potential trading opportunities.
A specialized trading indicator that generates entry and exit signals based on specific weekdays and predefined trading sessions, allowing traders to optimize trade timing and execution.
A comprehensive market timing indicator using True Strength Indicator (TSI) across multiple instruments to provide trading signals and market condition analysis.
A TradingView indicator that displays market sessions for USA, EUROPE, and ASIA, helping traders visualize active trading periods and potential market overlaps.
A TradingView chart overlay that adds day of the week labels to candlesticks, helping traders quickly identify and analyze daily trading patterns.
A volume performance table comparing daily trading volume against historical averages to validate price trends and identify potential market momentum shifts.
A visual trading tool that highlights specific days of the week with unique background colors to help traders identify potential weekly trading patterns and trends.
A chart visualization tool that dynamically colors chart backgrounds based on the day of the week, providing traders with an intuitive method to track and distinguish market movements.
A multi-timeframe break indicator that plots breaks across different time periods, offering traders a comprehensive view of market structure with timezone flexibility.
The Clownpumps Higher/Lower Close Analysis tracks daily market behavior by identifying whether assets consistently close higher or lower on specific weekdays.
A custom indicator tracking the frequency of True Day Open (TDO) retests during New York trading sessions, analyzing hit rates across different market conditions and weekdays.
A customizable indicator that highlights recurring time points on charts, allowing traders to visually mark specific weekdays, times, or combined conditions with configurable color and transparency.
Likes, views, and comments are historical TradingView snapshots. They describe attention, not trading performance.