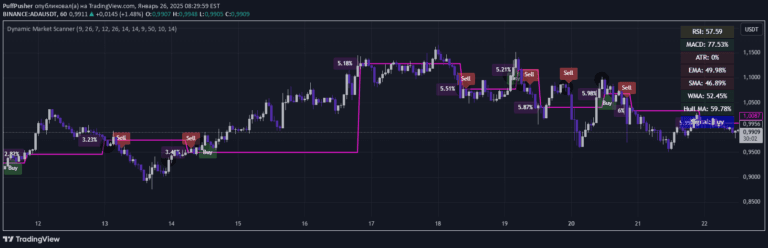
A comprehensive market timing indicator using True Strength Indicator (TSI) across multiple instruments to provide trading signals and market condition analysis.
Explore complementary indicator rolesHow it works
The TSI Market Timer integrates multiple technical indicators to analyze market conditions by applying the True Strength Indicator (TSI) with specific settings to different financial instruments. It calculates TSI values for the stock/source, SPY index, and DXY (US Dollar Index) to generate comparative signals and visual representations.
The indicator uses color-coded midline volatility tracking, with different colors representing varying volatility levels over 30 and 100-day periods. Green and red shading illustrates the relationship between the stock and index or trigger lines, while vertical line crossings and a stacked condition triangle provide additional market timing insights.
Why it may be useful
This multi-layered indicator helps traders understand complex market dynamics by simultaneously tracking multiple financial instruments and their relative performance. By providing visual representations of trend relationships, volatility levels, and crossover signals, traders can gain comprehensive insights into potential market movements and underlying economic conditions.
The TSI Market Timer's ability to compare different instruments offers traders a more nuanced view of market behavior beyond traditional single-instrument analysis. Its flexible settings and color-coded displays make it easier to quickly interpret market conditions and potential trading opportunities across different timeframes.
When to explore it
The TSI Market Timer is most effective during active market trading hours, particularly for stocks and during weekdays when all referenced instruments are actively trading. It works best when used in conjunction with other confirming indicators and volume analysis to validate potential trading signals.
Traders should be cautious about using this indicator during weekends or for cryptocurrency trading, as some referenced instruments may not update correctly. It is most suitable for traders seeking a comprehensive, multi-instrument market timing tool that provides detailed insights into trend relationships and market volatility.
Keep exploring
What we’ve verified
Access, alerts and repainting behaviour have not been independently verified for this indicator. Check the creator’s current publication and settings.
General descriptions and classifications are recovered research. Verified details above identify the specific checks we have completed. Check the creator’s current publication for later changes.